
One place for every report.
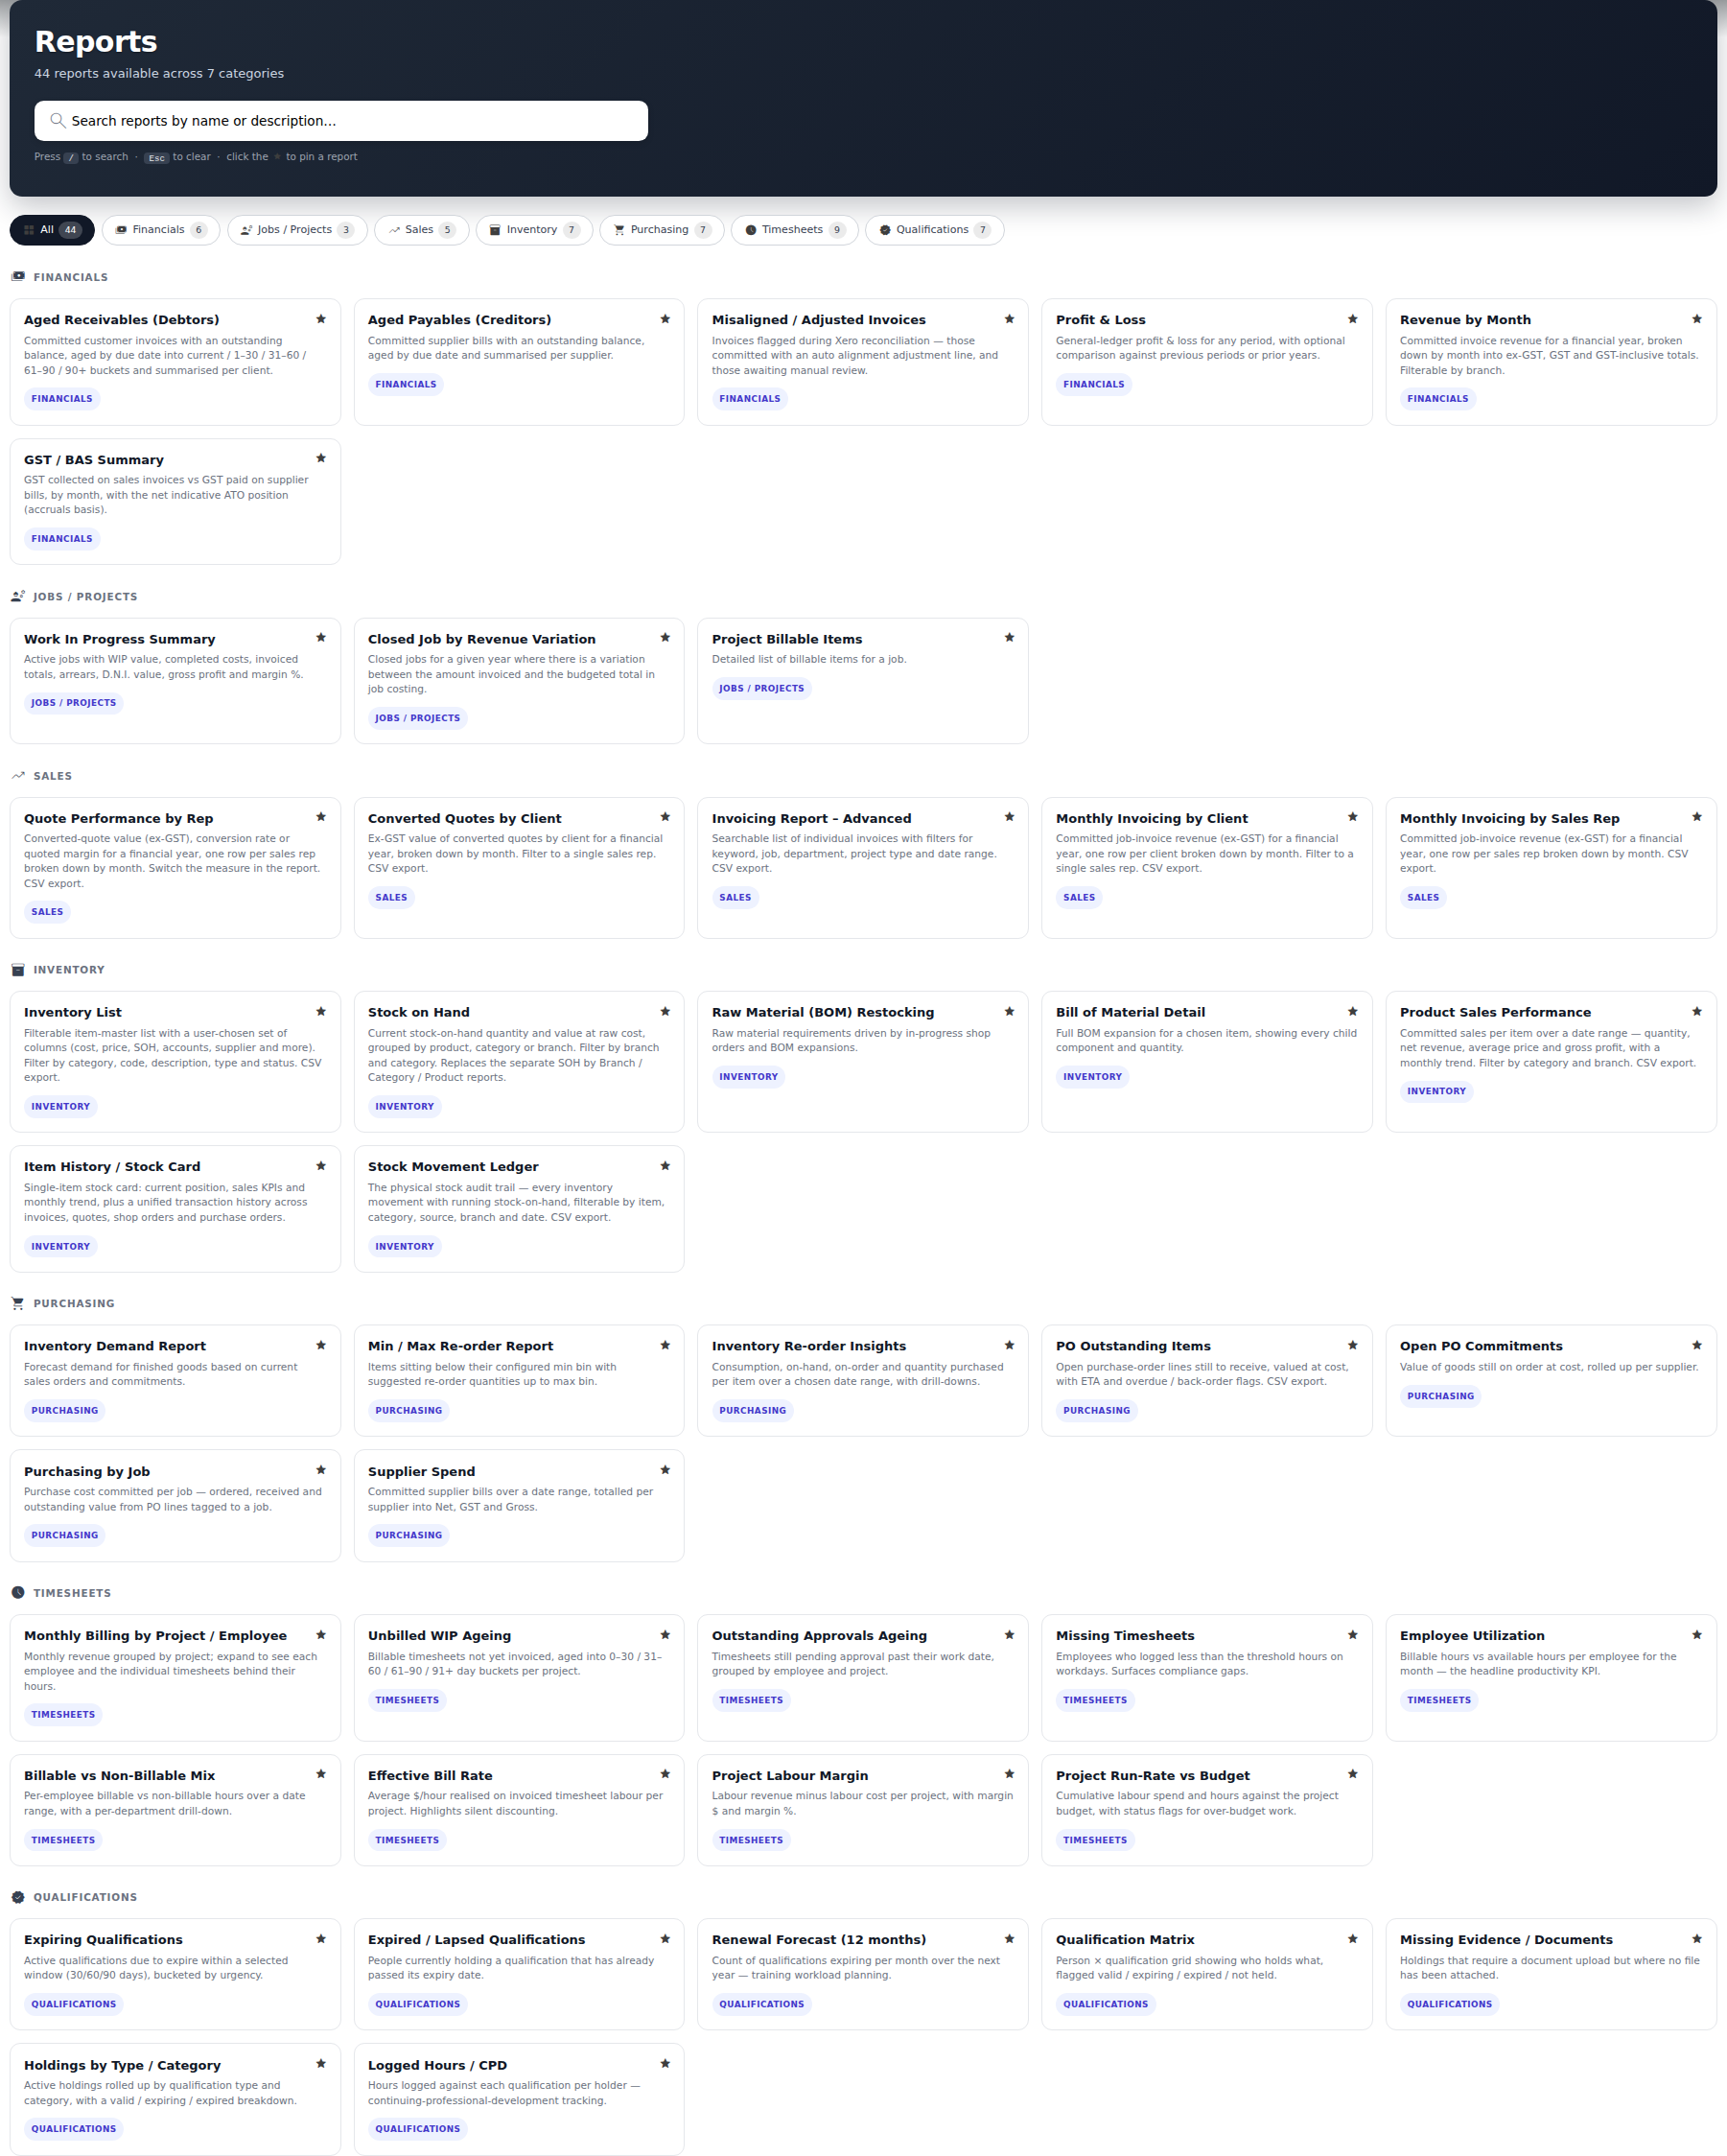
Evolution’s reporting has been rebuilt around a single, searchable Reports dashboard. Every report — financial, operational and compliance — is a card you can search by name, filter by area, and pin as a favourite. This guide describes what each report shows and how to read it.
The Reports Dashboard
Open it from Menu → Reports → Reports Dashboard. Instead of hunting through nested menus, you land on a grid of report cards with everything one keystroke away:
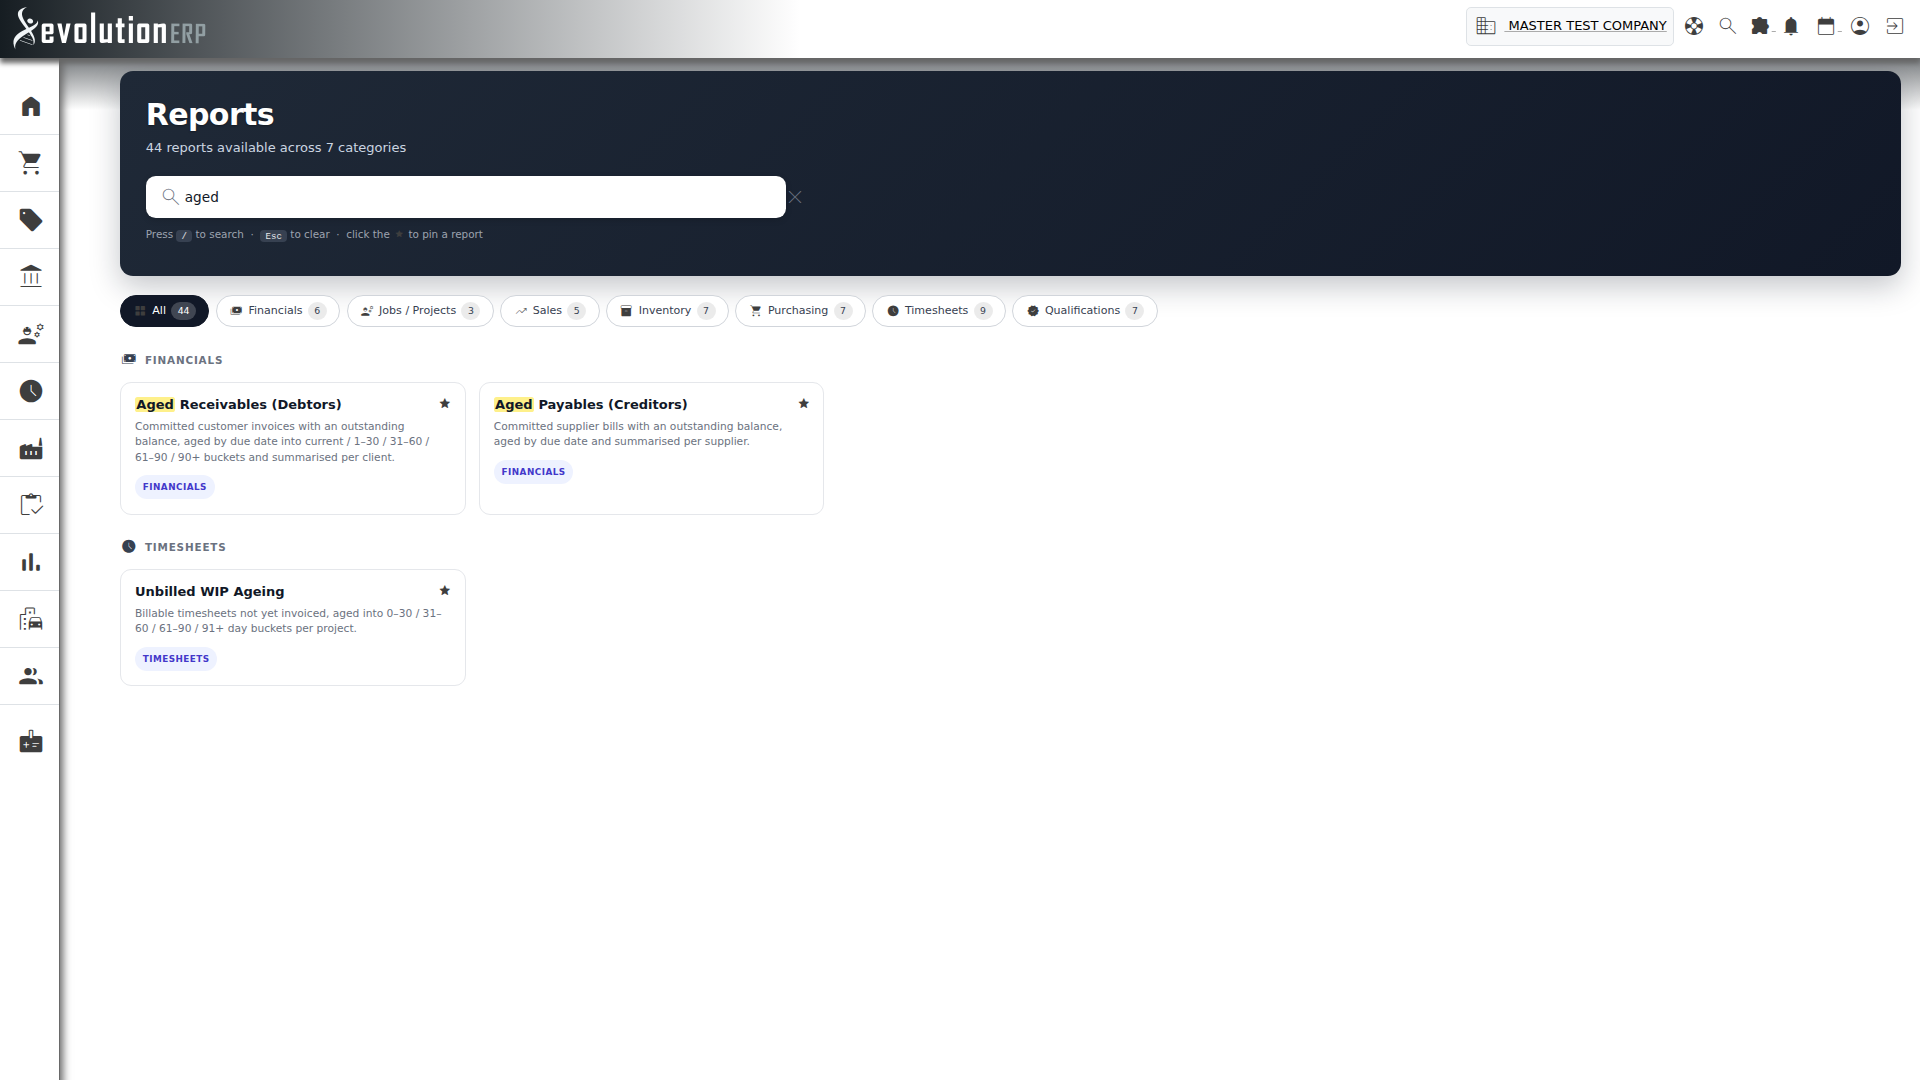
- Type-ahead search — start typing (or press /) to filter the whole library by report name or description in real time. Press Esc to clear.
- Category pills — click a pill (Financials, Sales, Inventory…) to show just that area. Each pill carries a live count of the reports you can see.
- Pinned favourites — click the star on any card to pin the reports you run most to the top. Your pins are remembered on your device.
- Permission-aware — you only see the reports your access allows, so the dashboard never shows a report you can’t open (see Who can see what below).
Reporting by Area
Reports are grouped by the part of the business they cover. Click an area for a description of every report in it and how to use it.
Financials 6 reports
Debtors and creditors ageing, profit & loss, revenue and GST / BAS.
- chevron_rightAged Receivables (Debtors)
- chevron_rightAged Payables (Creditors)
- chevron_rightProfit & Loss
- chevron_rightRevenue by Month
- chevron_rightGST / BAS Summary
Projects 3 reports
Work-in-progress, revenue variance and project billable items.
- chevron_rightWork In Progress Summary
- chevron_rightClosed Projects by Revenue Variation
- chevron_rightProject Billable Items
Sales 5 reports
Quote conversion, quoted margin and monthly invoicing by customer and rep.
- chevron_rightQuote Performance by Rep
- chevron_rightConverted Quotes by Customer
- chevron_rightMonthly Invoicing by Customer
- chevron_rightInvoicing Report – Advanced
Inventory 7 reports
Stock-on-hand, item analytics, the stock-movement ledger and manufacturing inputs.
- chevron_rightStock on Hand
- chevron_rightInventory List
- chevron_rightProduct Sales Performance
- chevron_rightItem History / Stock Card
- chevron_rightStock Movement Ledger
Purchasing 7 reports
Supplier spend, open PO commitments, purchasing by project and re-ordering.
- chevron_rightSupplier Spend
- chevron_rightOpen PO Commitments
- chevron_rightPurchasing by Project
- chevron_rightMin / Max Re-order
- chevron_rightDemand Deficit
Timesheets 9 reports
Monthly billing, unbilled WIP, labour margin, utilisation and data quality.
- chevron_rightMonthly Billing by Project / Employee
- chevron_rightUnbilled WIP Ageing
- chevron_rightProject Labour Margin
- chevron_rightEmployee Utilization
Qualifications 7 reports
Expiring and expired tickets, the compliance matrix and evidence gaps.
- chevron_rightExpiring Qualifications
- chevron_rightExpired / Lapsed Qualifications
- chevron_rightQualification Matrix
- chevron_rightMissing Evidence / Documents
Shopify 4 reports
Category/collection mapping, price discrepancies and catalogue gaps between Evolution and Shopify. Only shown when the Shopify plugin is connected.
- chevron_rightCategory & Collection Mapping
- chevron_rightSKUs Missing from Evolution
- chevron_rightItems Missing from Shopify
- chevron_rightPrice Discrepancies
Common Conventions
Most reports share the same controls, so once you learn one you have learned them all:
- Filter bar — a consistent row of filters across the top. Multi-select filters default to “All”; picking a specific value clears the placeholder.
- Date filters — either a month picker (with previous / next chevrons) or a date range. Many reports offer quick periods (this month, this financial year, last 12 months…) and cap the range (typically 12 months) to keep queries fast.
- Run — refreshes the data after you change filters. Most reports also run automatically on first load.
- Search & sort — a live search box narrows the visible rows, and clicking a column header sorts by it (click again to reverse).
- Drill-downs — click a chevron or a highlighted value to expand the detail behind a row without leaving the page.
- Click-through — codes, projects, invoices and contacts are hyperlinked straight to their record.
- CSV export — every report exports the currently displayed rows for finance or a board pack.
Who Can See What
The dashboard only shows the reports your access allows. Access is governed by your staff permissions:
- Financials require General Ledger (admin-level) access.
- Sales requires admin-level access on Sales or Business Registers — either one is enough.
- Qualifications require Business Registers (admin-level) access.
- Projects, Inventory, Purchasing and Timesheets are open to any signed-in user.
- Shopify reports additionally require the Shopify plugin to be connected for your company — the pill is hidden entirely otherwise.
- Administrators see everything.
If an area or a report is missing for you, it is almost always a permission setting — ask your administrator.