Where to Find Them
Menu → Reports → Reports Dashboard, then the Projects pill.
These reports require Job Costing access at the admin (full) level, or administrator access. A Branch selector sits in the report header (top right), alongside print and email actions.
Project and WIP Reports
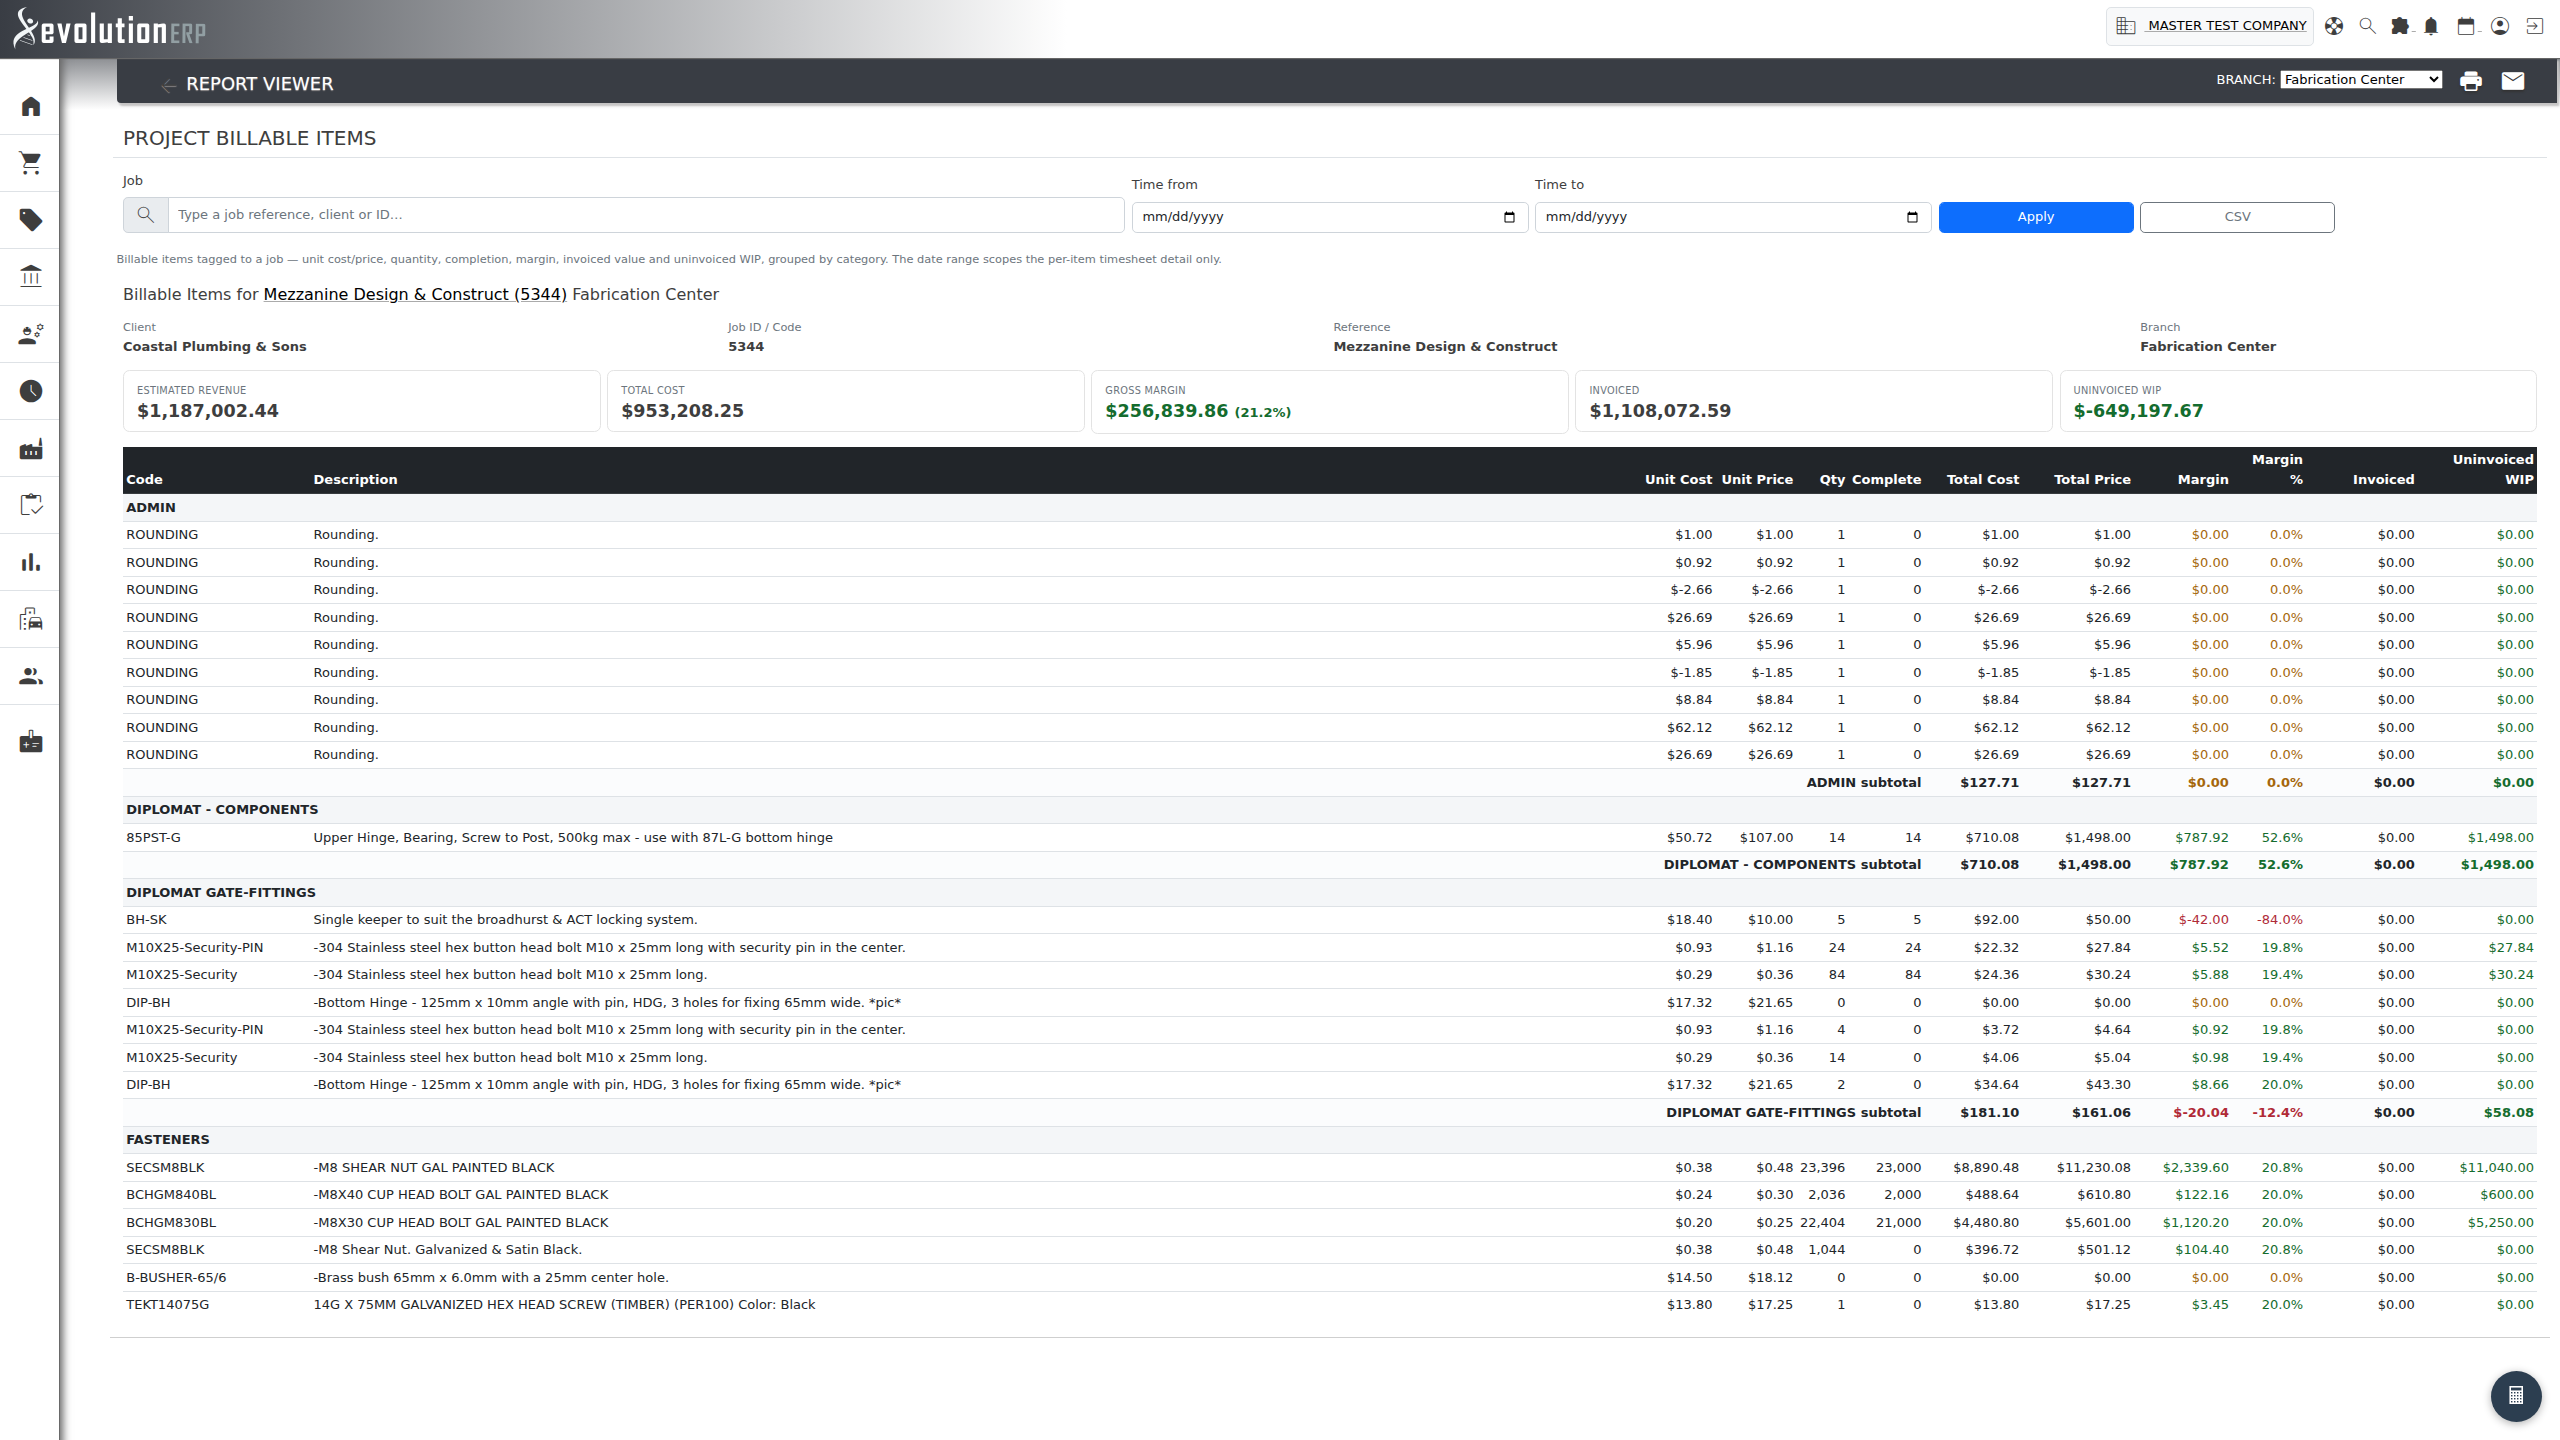
Work In Progress Summary
What it shows: A live snapshot of every active project, valued from Project Inventory. Each row shows the assigned Rep, Status (New / In progress / On hold) and:
- Contract Value — The project's contract value. Do-and-charge / T&M projects (no fixed price) are valued at their cost take-up.
- Budget Cost — Total budgeted cost of all project inventory (quantity × cost).
- Total Costs — Cumulative standard cost of items marked complete (the cost take-up).
- Actual Cost — The real cost incurred against the project — supplier bills, timesheets, GL consumables, shop orders and picking — as accumulated on the project's costing tab. This is a cached figure: it is refreshed whenever someone opens that tab, so it is as fresh as the last such view rather than live, and shows $0 for a project that has never been costed.
- Cost in Progress — Actual cost minus Total Costs: the actual money spent on work that has not yet been marked complete. This is the true cost-basis work-in-progress — the cost sitting on the project ahead of recognition — which the completion-driven columns on their own do not show. It is blank for a project that has never been costed. Where it is large, actual spend is running ahead of recorded completion (typical on a progress-claimed project) and the completion-based figures below will understate progress.
- Complete % — True cost progress: completed cost as a percentage of budgeted cost.
- Backlog — Contract value minus the cost of completed work — a work-in-hand measure of how much contract remains above the cost spent so far. (This column was previously labelled WIP; it is a backlog figure, not an accounting work-in-progress balance.)
- Invoiced — Committed invoiced revenue for the project. Draft, voided and deleted invoices are excluded (matching the AR / finance reports).
- Earned Rev — Earned revenue on a percentage-of-completion basis: the sell value of completed billable work (quantity complete × sell price). Do-Not-Invoice work is excluded because it will never be billed.
- Billing Position — Earned revenue minus invoiced. This is the true over/under-billing position on a revenue basis:
- Positive (under-billed) — you have earned more than you have billed: unbilled WIP, a contract asset still to be claimed.
- Negative (over-billed) — you have billed more than you have earned: billings in excess of costs and earnings, a contract liability (deferred revenue). This is the normal position on a forward-invoiced / progress-claimed project and is the correct way to read one — unlike Backlog, which stays large and positive even when a project is heavily over-billed.
- Arrears — The same over/under-billing idea on a cost basis: billable value of completed work not yet invoiced, net of D.N.I. A negative figure (red) means the project is over-billed. (Billing Position is the sell-basis equivalent and is generally the clearer figure.)
- D.N.I. — "Do Not Invoice" value: the completed cost of items flagged never to be billed to the customer.
- Gross Profit — Invoiced revenue minus completed cost.
- Margin % — Gross profit expressed as a percentage of the contract value.
Summary tiles across the top aggregate total backlog, billing position, contract value, completed cost, actual cost, cost in progress, invoiced, margin dollars, overall gross-profit %, pending invoicing and total D.N.I. for the projects matching your filters.
Filters & tools:
- Filter by Branch (including All branches), Project type (multi-select), Rep, Project manager, Status and a minimum Backlog threshold.
- Use the table search box to find a customer, project number or PO; sort any column; results are paginated.
- Download CSV exports the current result set (including the totals row) for Excel.
- Click a project number to open the underlying project in a new tab. Sort by Gross Profit or Margin % to rank projects by profitability, or sort Billing Position ascending to surface the projects that are most over-billed (billings in excess).
Closed Projects by Revenue Variation
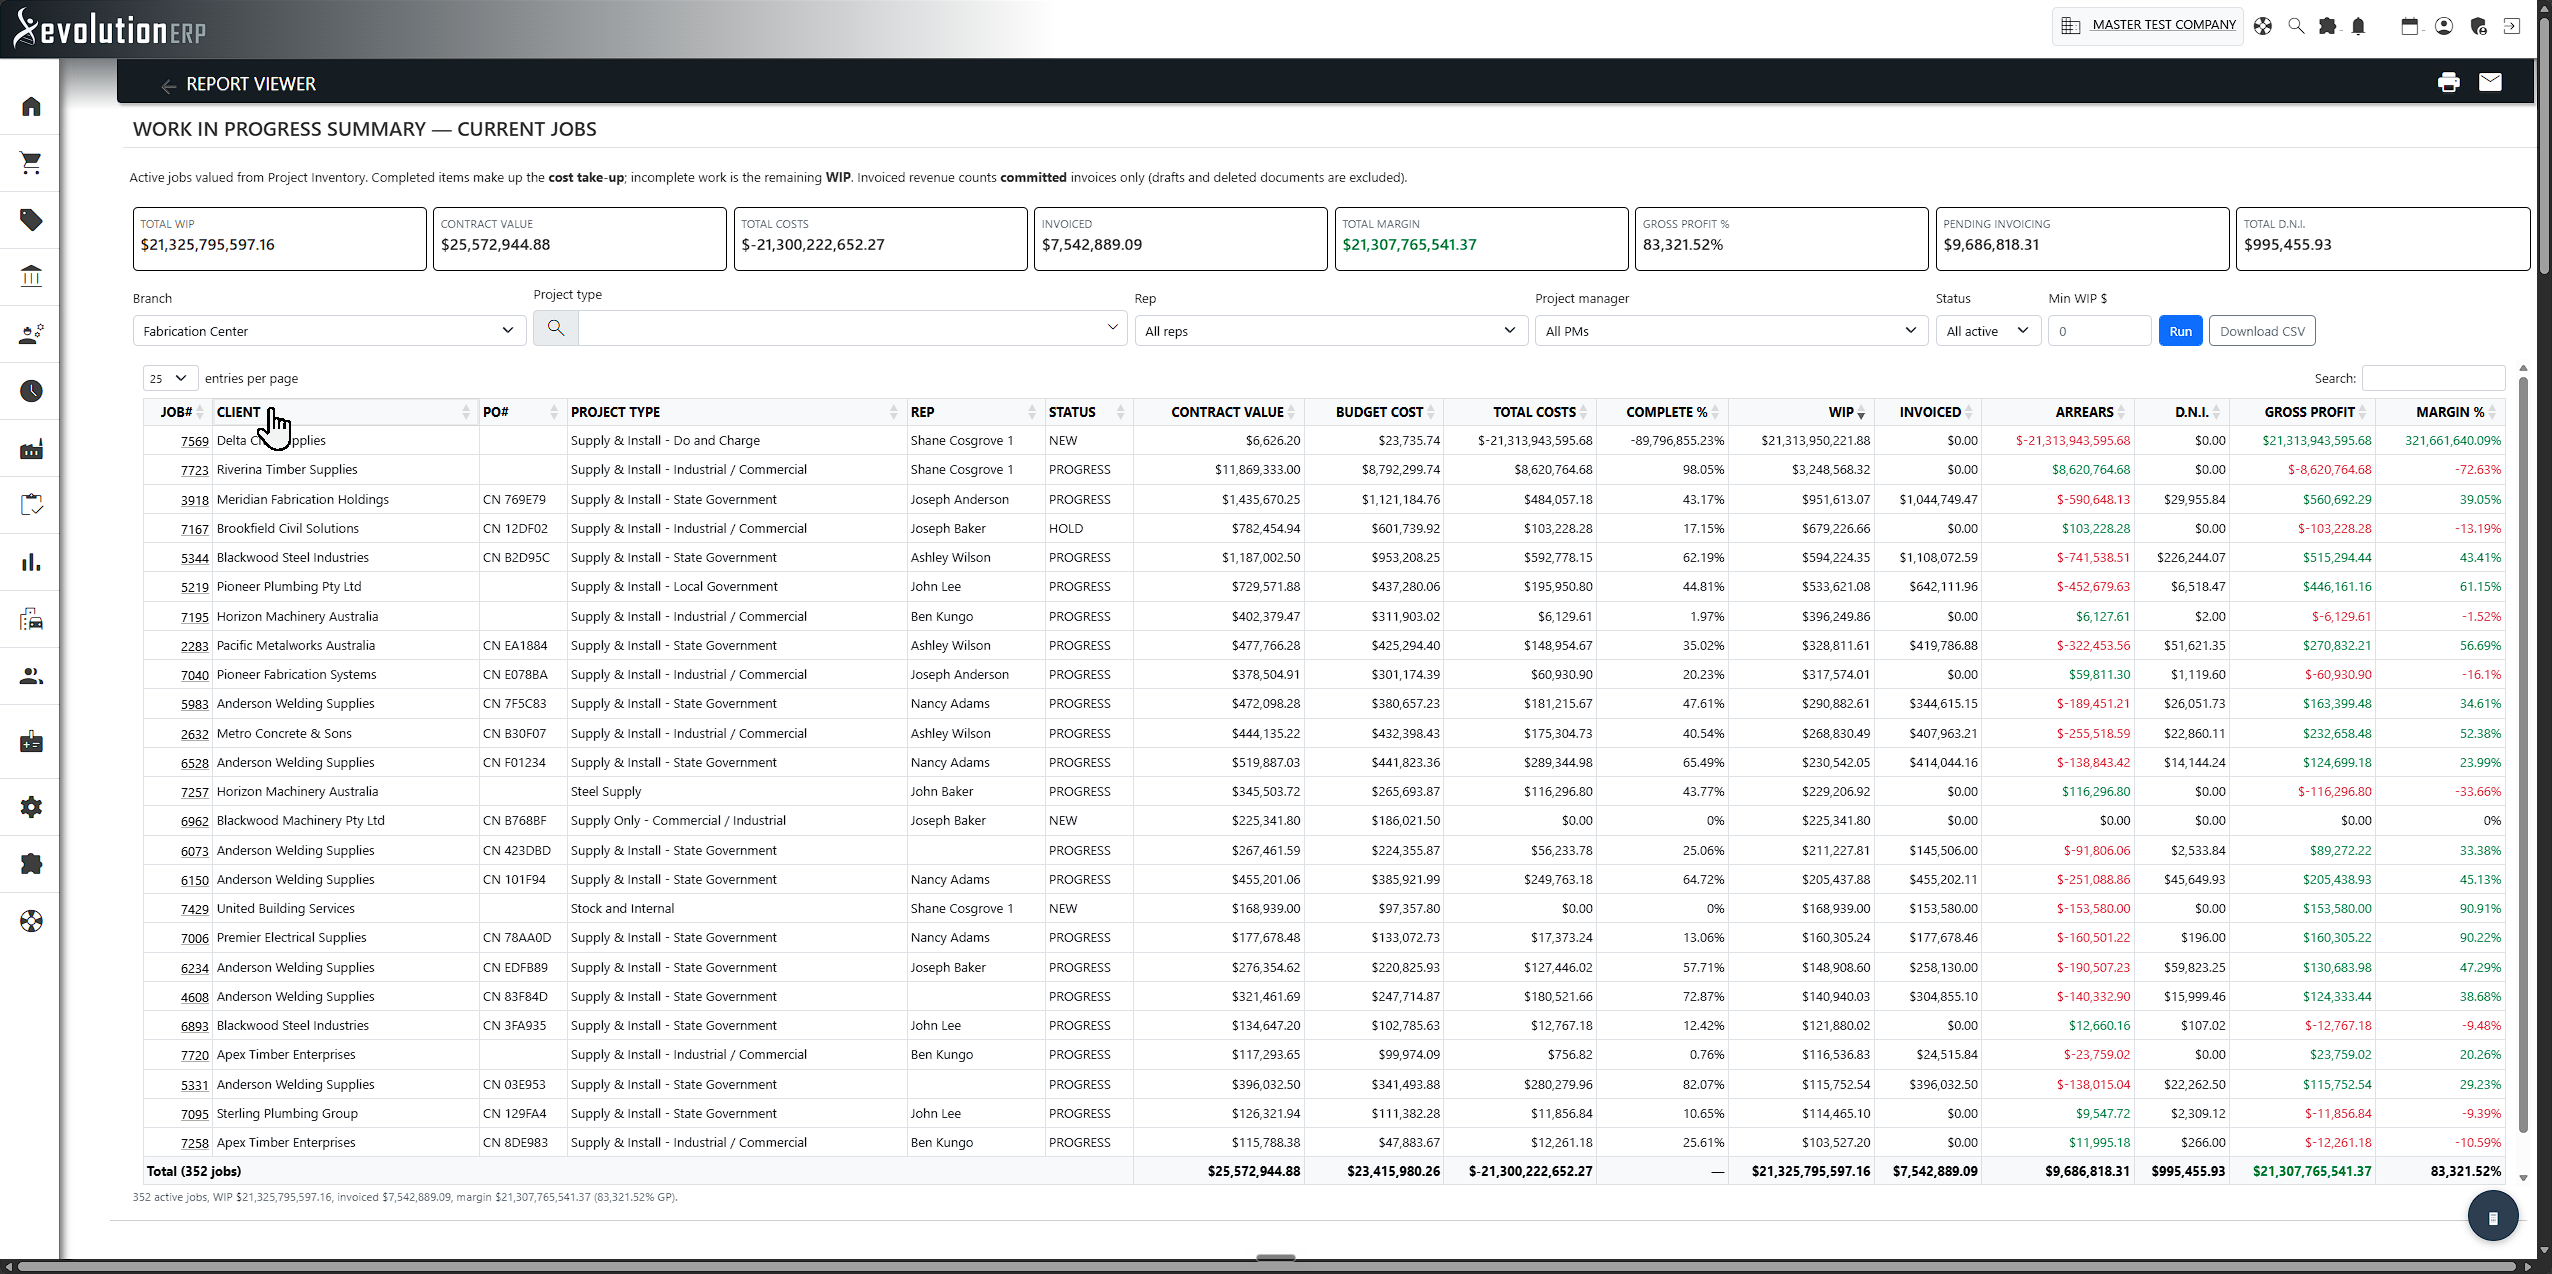
What it shows: Closed projects where the invoiced total differs from the budgeted total in job costing. The Variation is Invoiced − Budget (standard actual-vs-budget variance):
- Positive variation (green) — billed above budget (over-recovery / added variations).
- Negative variation (red) — billed below budget (under-recovery / write-down).
- Variation % — the variation as a percentage of budget.
Each row also shows the assigned Rep and Project Manager. Projects invoiced exactly to budget are omitted. Invoiced revenue is summed from the job-tagged invoice lines (matching the WIP report), so lines billed on an invoice raised against another project are still counted.
Filters & tools:
- Period — a date range (with quick presets for month, financial year and calendar year) applied to each project's last-updated date, used as an approximation of when the project was closed. Leave blank for all closed projects.
- Branch, Project type, Rep and Project manager filters.
- Direction — limit to projects billed above, or below, budget.
- Min variation % — hide small discrepancies to focus on the material ones.
- Type in the table's search box to filter by project number, customer or PO on the fly.
How to use it: Use it to spot closed projects that need a post-mortem. The results are paginated and every column is sortable — sort by variation size or percentage to focus on the largest discrepancies. A footer row totals budget, invoiced and variation for the current filters, and Download CSV exports the full result set for further analysis.
Project Billable Items
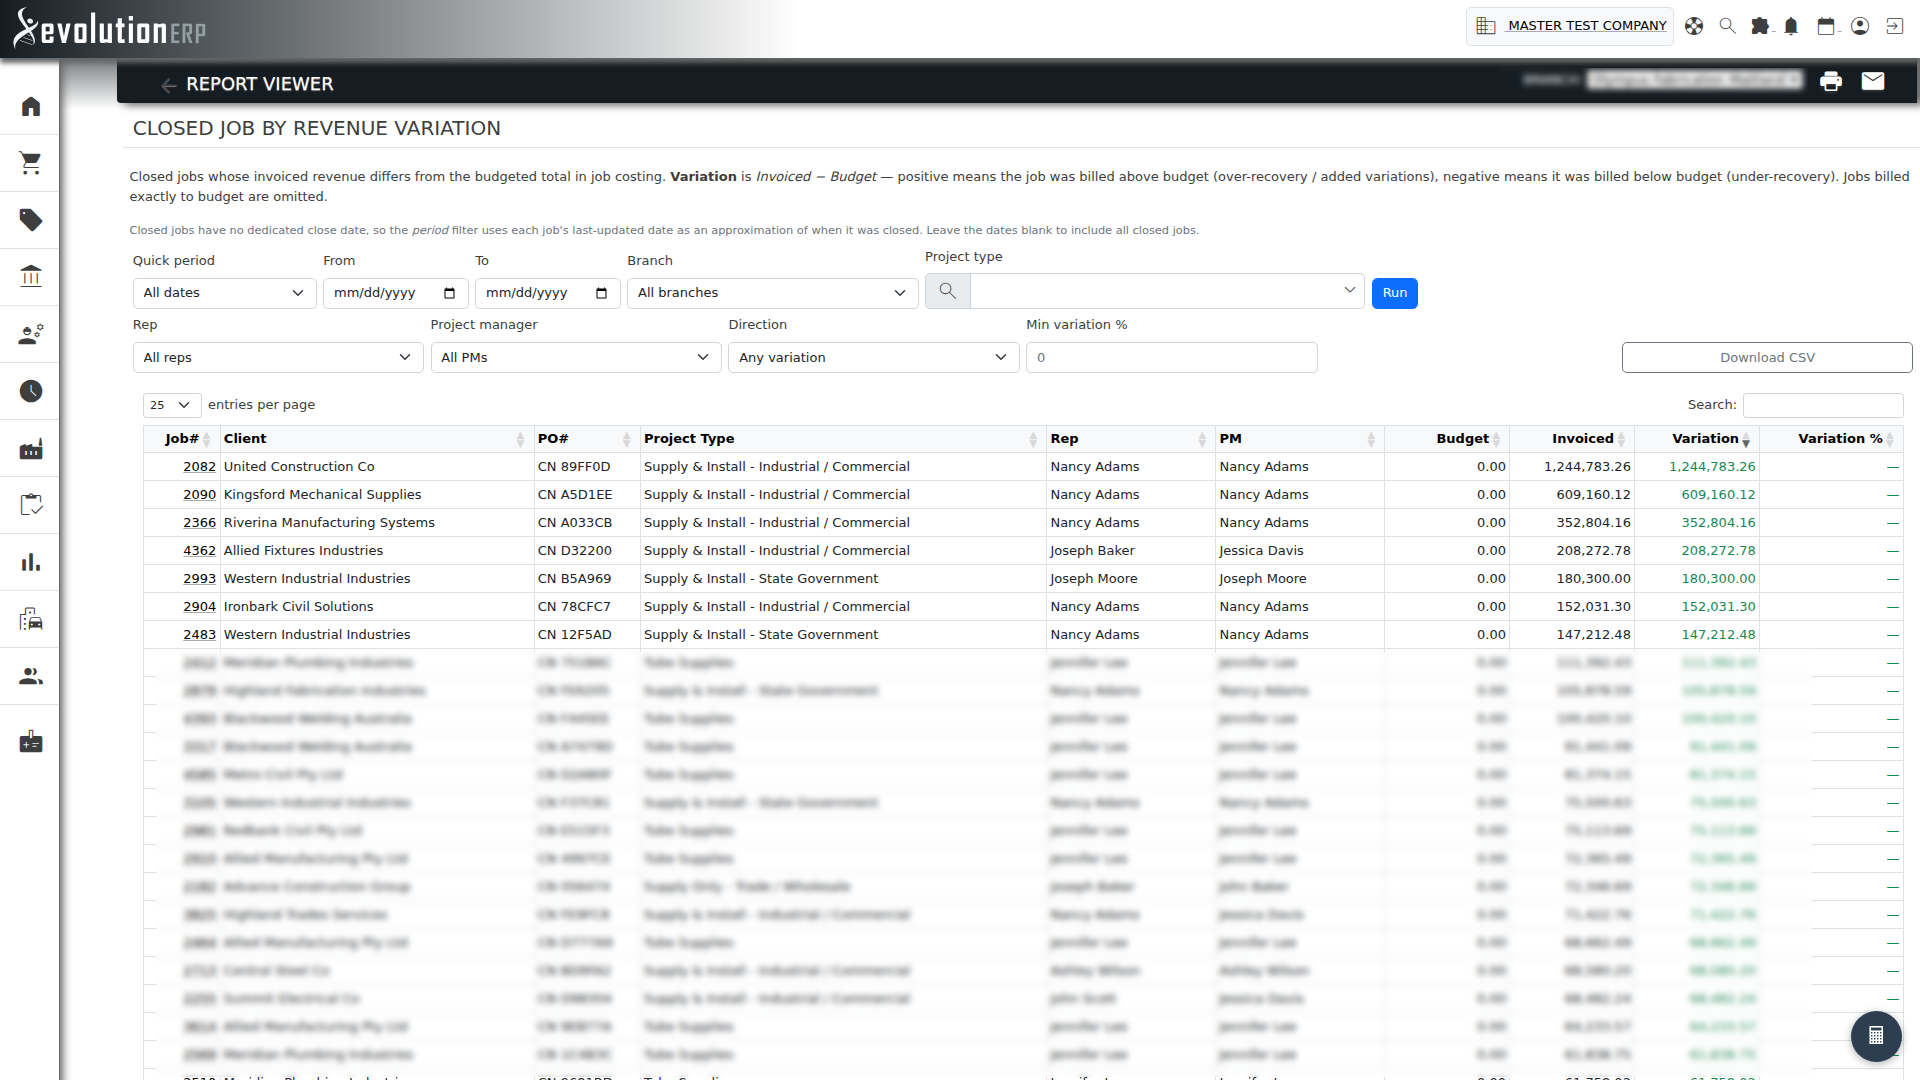
What it shows: A detailed, per-item billing breakdown for a single project. A header block summarises the project — Customer, Project ID/Code, Reference and Branch — followed by a row of headline figures: Estimated Revenue, Total Cost, Gross Margin (dollars and %), Invoiced and Uninvoiced WIP.
Items are grouped by inventory category, each group with its own sub-total, and every row shows Unit Cost, Unit Price, Qty, Qty Completed, Total Cost, Total Price, Margin and Margin %, Invoiced and Uninvoiced WIP. Margin figures are colour-coded (green healthy, amber thin, red negative) so under-water items stand out at a glance. Any invoicing tagged to the project but not to a specific item is shown as a separate footer line, and the table footer totals the whole project.
This report is read-only and available to anyone with Job Costing access (read or admin) — unlike the other reports on this page it does not require the admin level. Opening it never changes the underlying project.
How to use it:
- Start typing in the Project search box — project reference, customer name or ID — and pick a match to load it (or arrive here from the Uninvoiced WIP link on a project's costing tab).
- Set an optional Time from / Time to range and press Apply to scope the per-item timesheet detail to a period (e.g. time logged this month). Leave blank for all time.
- Expand an item's timesheet detail (the arrow beside its code) to see the individual time entries behind its labour, with each entry's hours, billed value and whether it has been invoiced.
- Read the category sub-totals and the table footer to see where margin is being made or lost, and how much remains uninvoiced — useful when preparing an invoice or auditing what should have been billed.
- Click CSV to export the full item breakdown for the current project.
- Print with the optional Include time entries toggle to add the timesheet detail to the printout.