
Where to Find Them
Menu → Reports → Reports Dashboard, then the Timesheets pill.
The Timesheets section contains nine reports organised across four groups — Billing & Revenue, Profitability, Utilisation, and Compliance & Data Quality. They require reporting access — if you don't see them, contact your administrator.
Each report runs in the browser: set the filters, click Run, and export the current results with the CSV button. Rows come back already sorted in the most useful order for that report — the tables are read-only, so you re-slice the data by adjusting the filters rather than by clicking column headers.
Billing & Revenue
What did we sell, and what should we still bill?
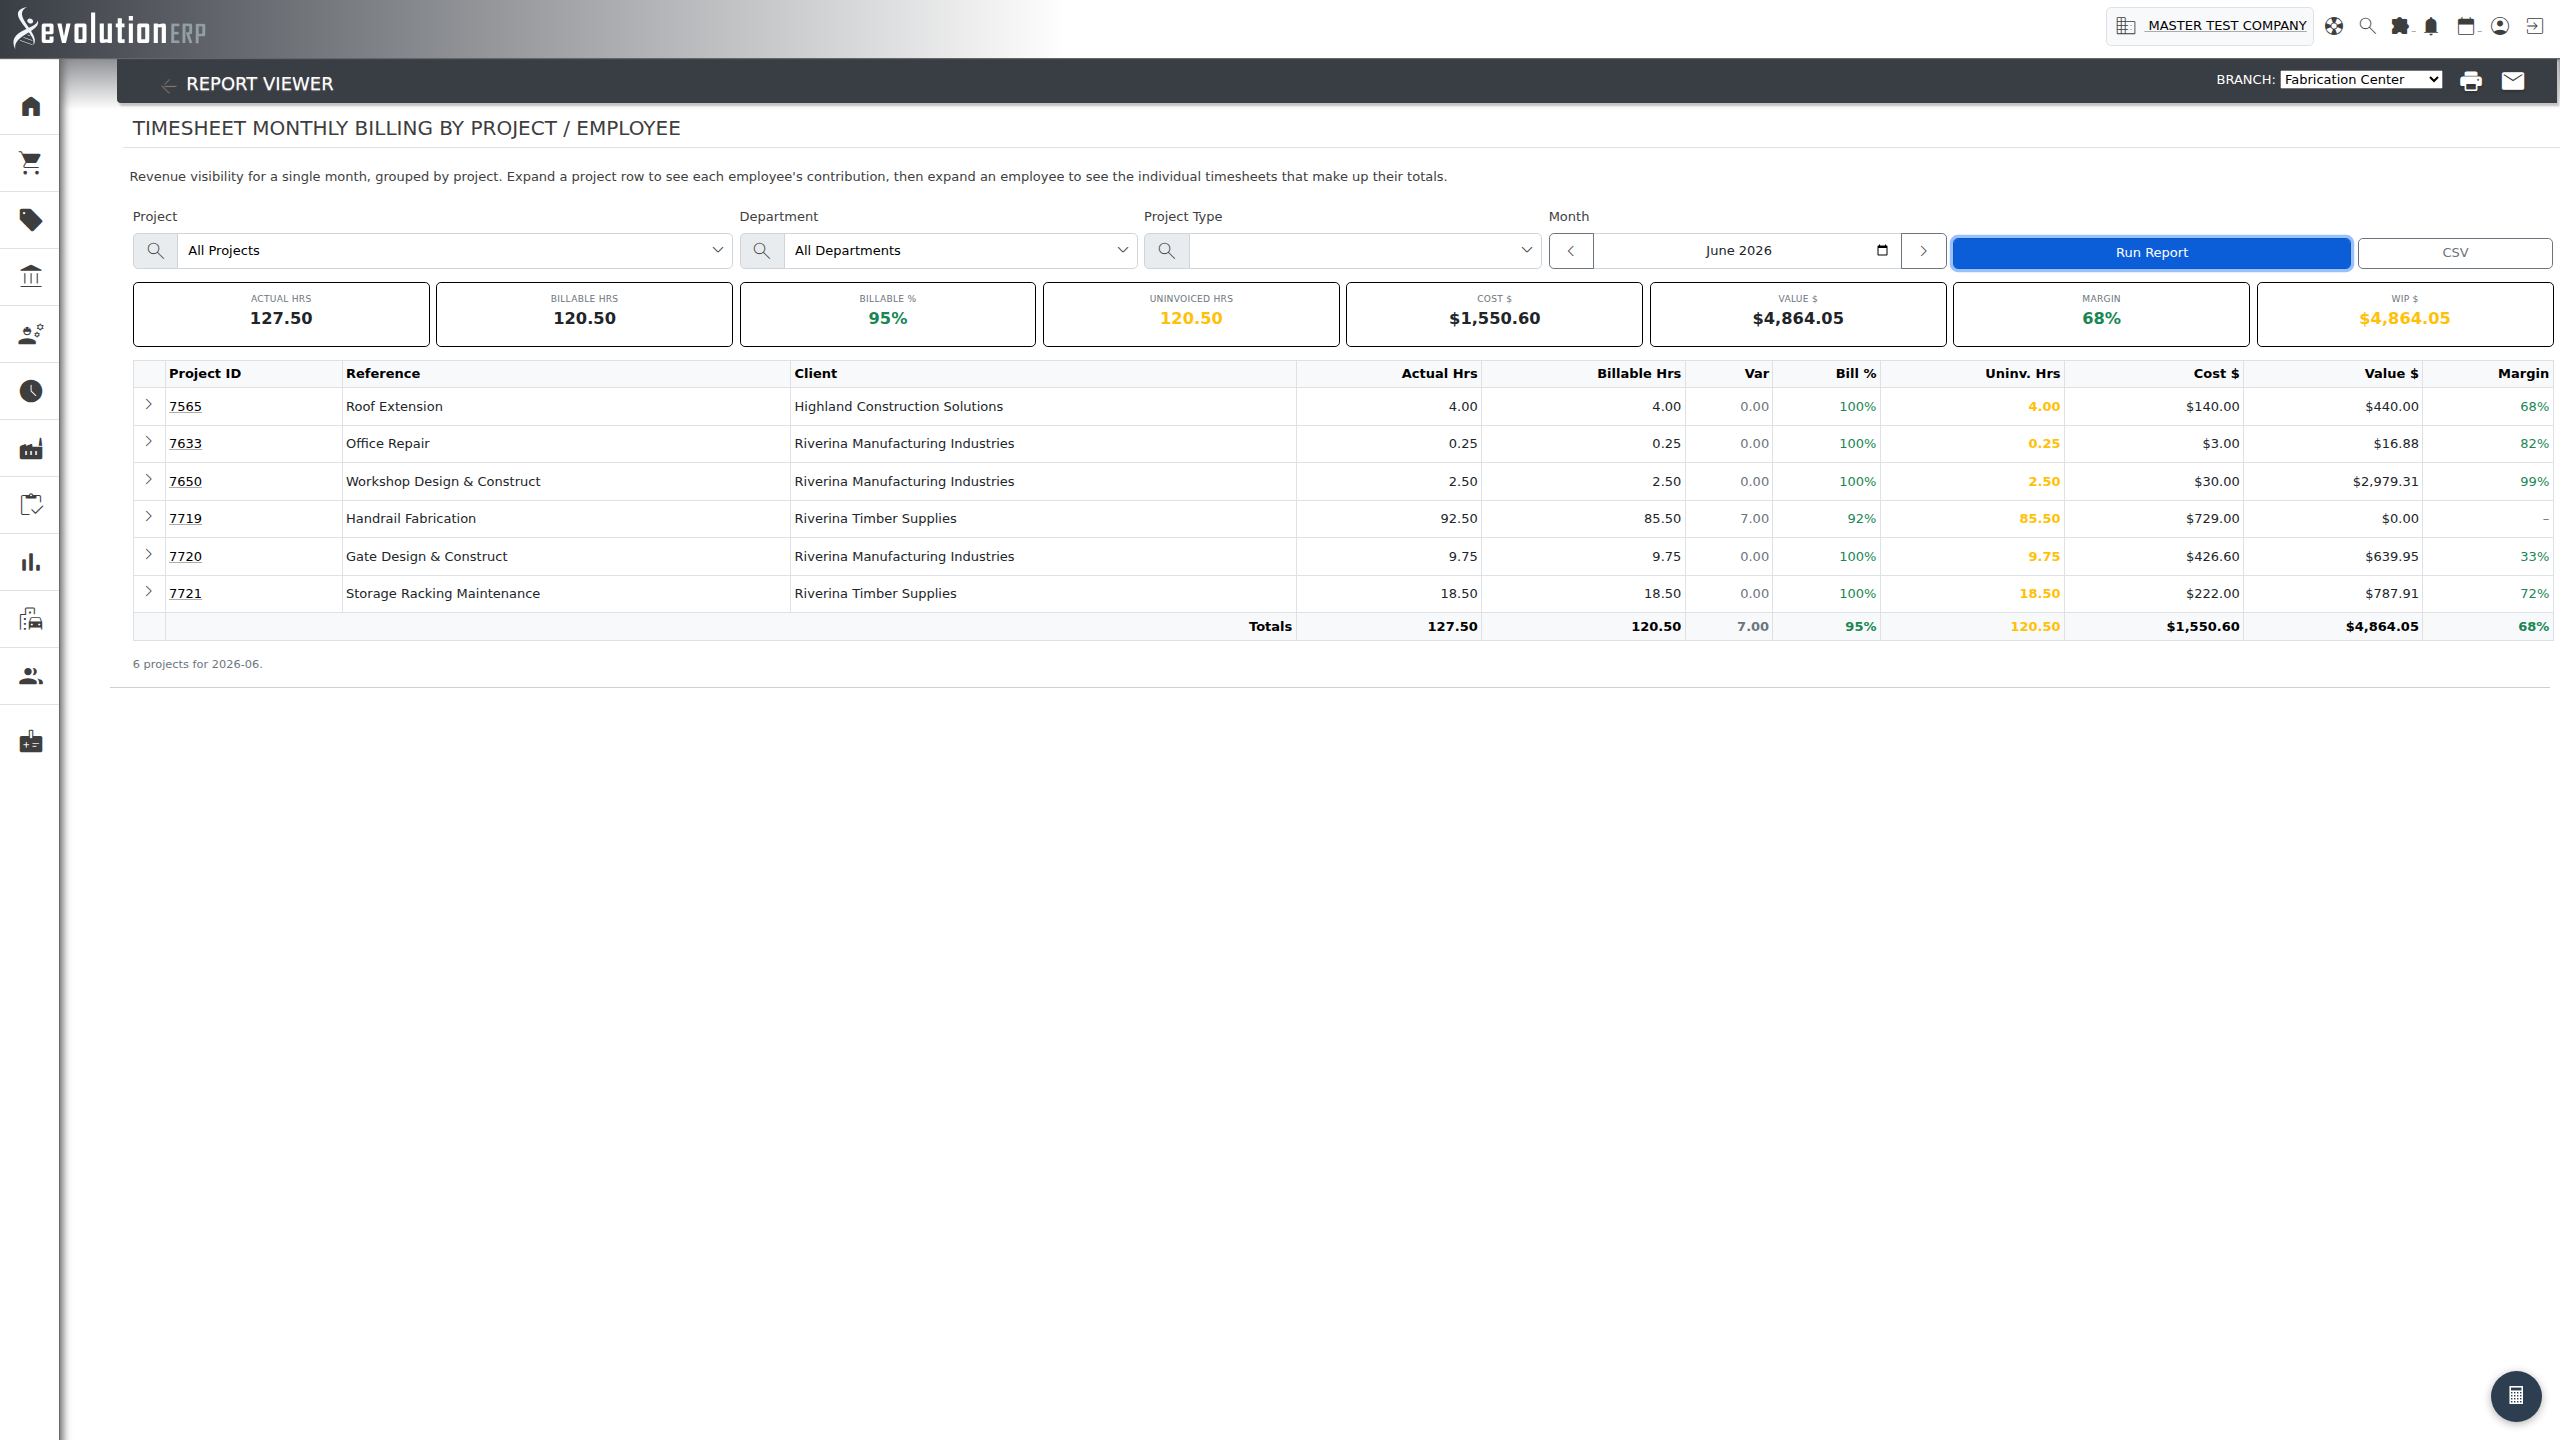
Timesheet Monthly Billing by Project / Employee
What it shows: A single view of the month's revenue picture. Projects are listed with hours, dollars and billing status, and drill down twice — project → employees → individual timesheets. A row of summary tiles across the top gives the month's headline figures.
The columns:
- Actual Hrs — hours actually clocked (from the timesheet start/end times).
- Billable Hrs — chargeable hours entered against billable project lines.
- Var — Actual minus Billable. Shown in red if more was billed than was clocked, which is worth a look.
- Bill % — labour recovery: Billable ÷ Actual. Green is healthy, amber/red is low recovery.
- Uninv. Hrs — billable hours not yet invoiced (work in progress), highlighted amber when there is WIP to bill.
- Cost $ — labour cost from the timesheet cost rates.
- Value $ — billable value at the project's labour sell rates.
- Margin — (Value − Cost) ÷ Value, green when positive.
How to use it:
- Pick the Month via the date selector, or use the previous / next chevrons to flick through months.
- Narrow the view by Project or Department (both default to "All"), or by Project Type — note the Project Type filter starts on the first type in the list, so switch it if you want a different one.
- Click the chevron at the start of a project row to load each employee's contribution; click again on an employee row to see the individual timesheets, including their line-item descriptions and Invoiced / Approved badges.
- Watch for a yellow data-quality banner: it appears when one or more timesheets have an impossible clock time (end before start). Those entries are excluded from the totals so they can't skew the figures — click Show to list them and correct them at source.
- Click CSV to download the project-level totals, including every column above plus the invoiced / uninvoiced split.
Unbilled WIP Ageing
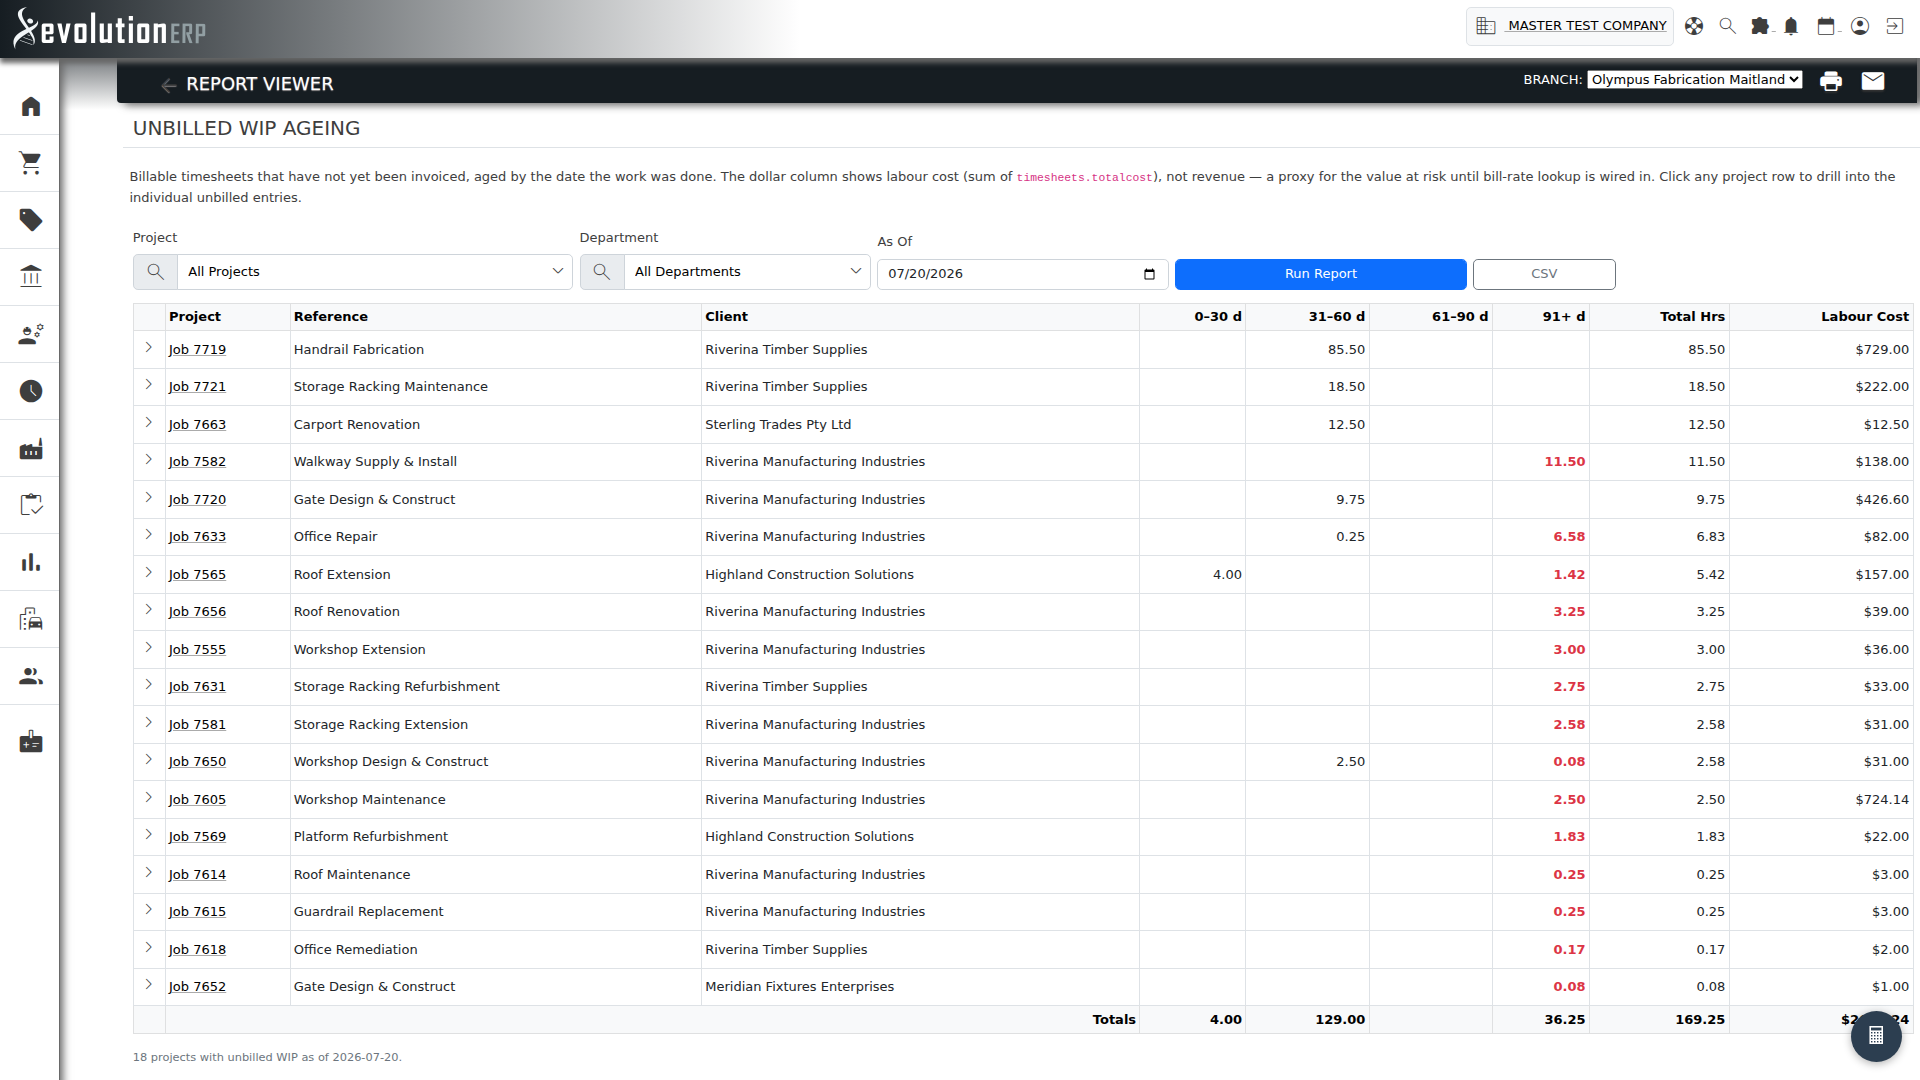
What it shows: Billable timesheets that have not yet been invoiced, aged into 0–30 / 31–60 / 61–90 / 91+ day buckets per project. The bucket figures are billable hours, not dollars — a separate Labour Cost ($) column shows the cost value of that unbilled time. The 91+ bucket is highlighted in red as the oldest, most at-risk WIP.
How to use it:
- Adjust the As Of date to ask "what was unbilled as at a point in time?"
- Filter by Project or Department to narrow down to a manager's scope.
- Click the chevron on a project row to see the individual unbilled entries.
- Projects are listed with the most unbilled hours first, so the biggest WIP to chase is at the top.
Profitability
Which projects are actually making money on labour?
Project Labour Margin
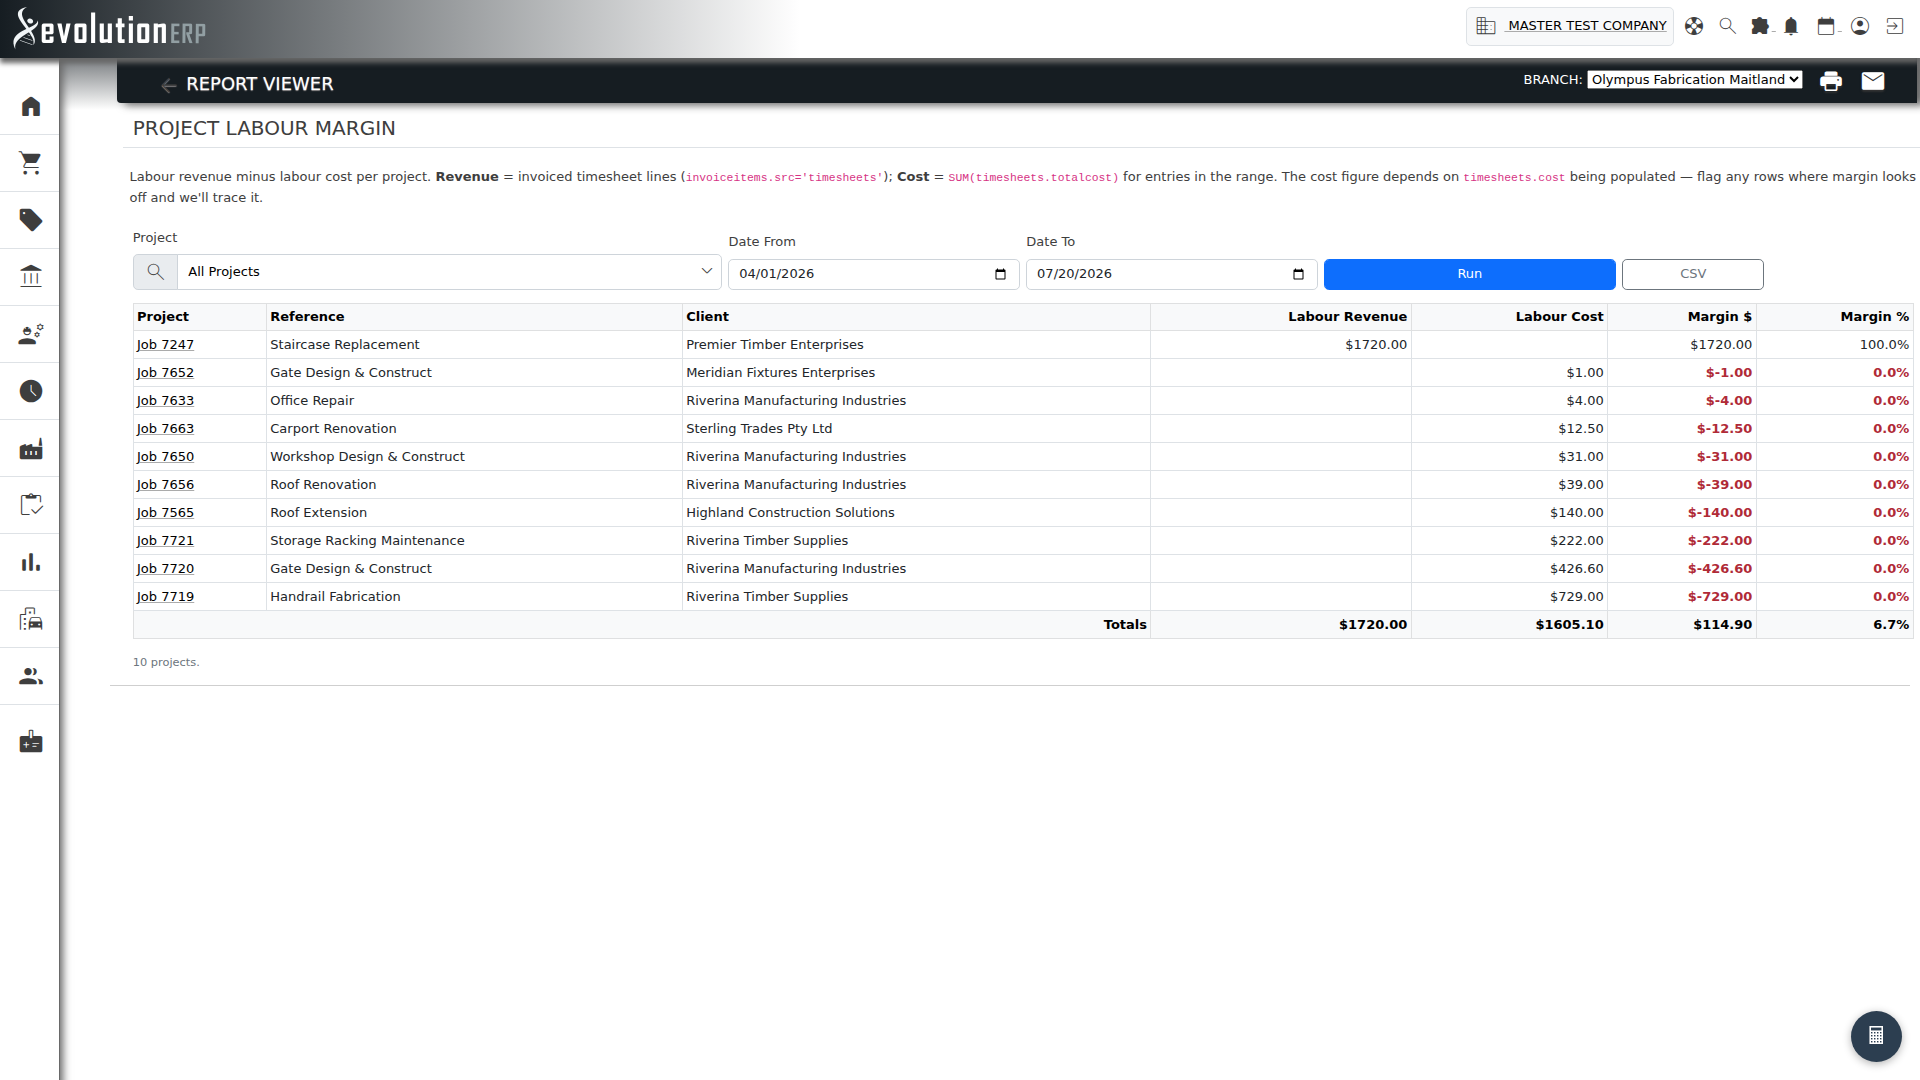
What it shows: Labour revenue (invoiced timesheet lines) minus labour cost per project, with margin $ and margin %. Negative margins are flagged in red, and thin margins (below 20%) in amber.
How to use it: Filter to a date range and Run. Projects are listed worst-margin first, so the projects bleeding money on labour sit at the top. A footer row shows the blended margin across all selected projects.
Effective Bill Rate
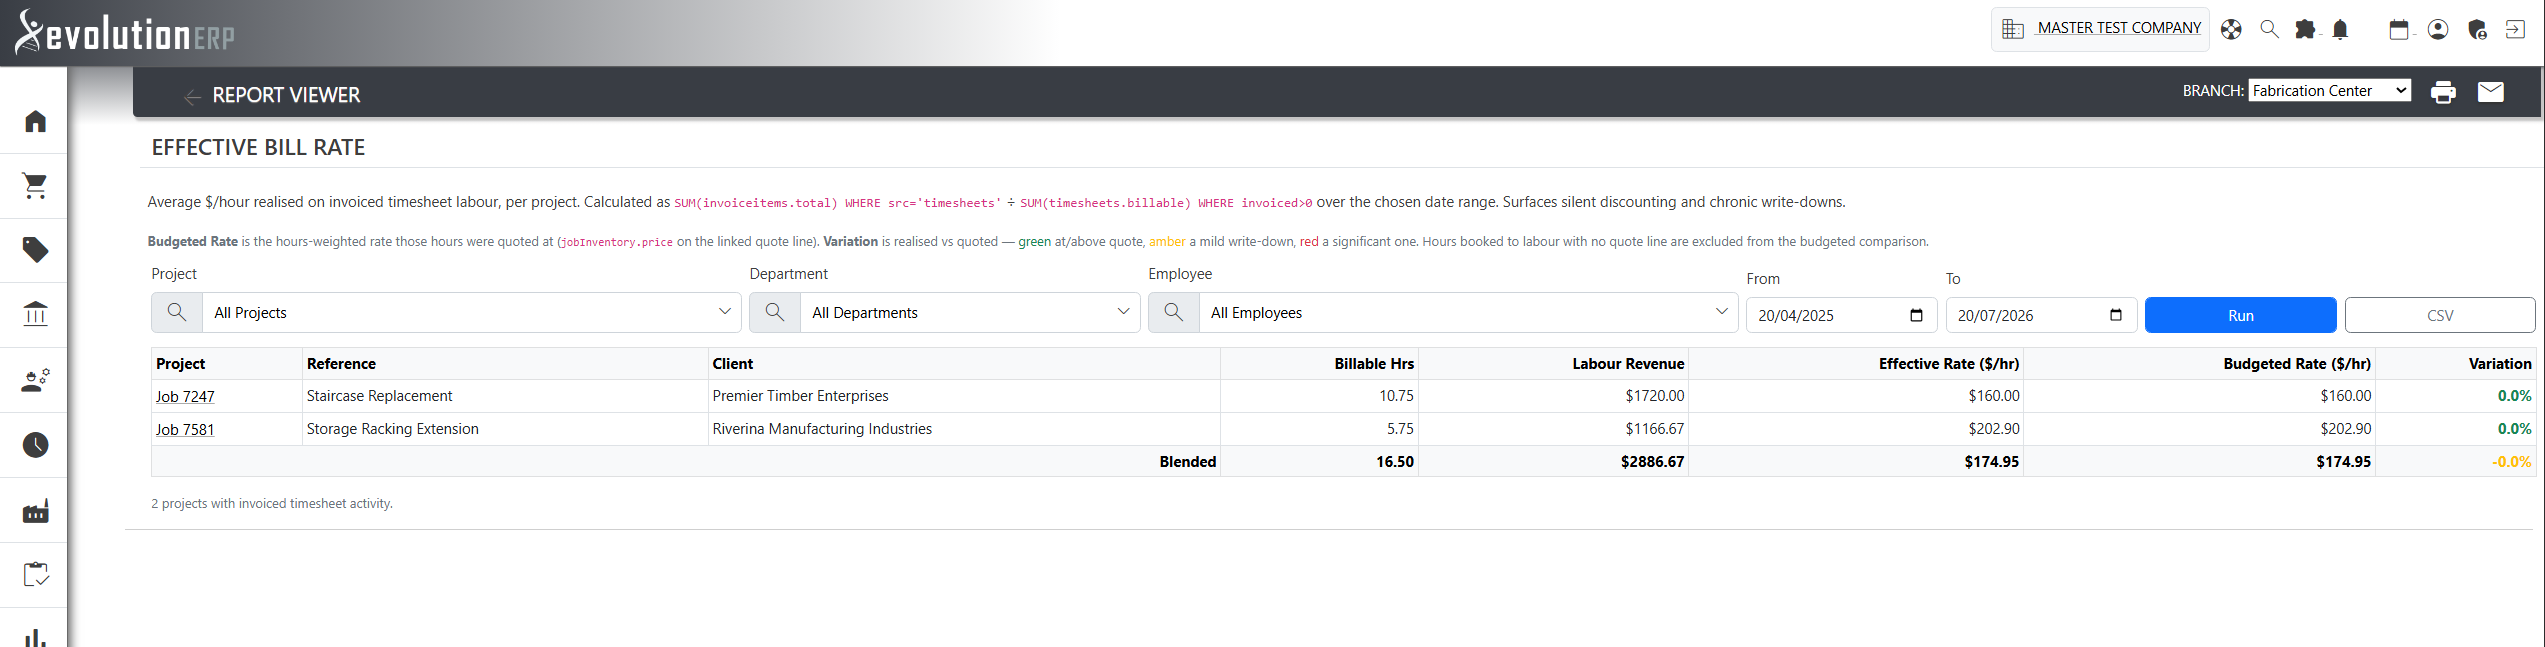
What it shows: Average dollars per hour realised on invoiced labour, per project. Surfaces silent discounting and chronic write-downs — if the standard rate is $150 but a project is clocking $112/hr realised, that gap is a conversation worth having.
How to use it: Projects are listed with the lowest realised rate first, so the worst-discounted work is at the top. A blended rate sits in the footer.
Budgeted comparison: Alongside the realised rate, the report shows the Budgeted Rate — the hours-weighted rate that labour was originally quoted at on the project's line items — and a colour-coded Variation comparing the two. Green means the project billed at or above quote; amber is a mild write-down (down to 10%); red flags significant discounting (more than 10% below quote). Hours booked against labour with no quoted line are excluded from the comparison and show a dash.
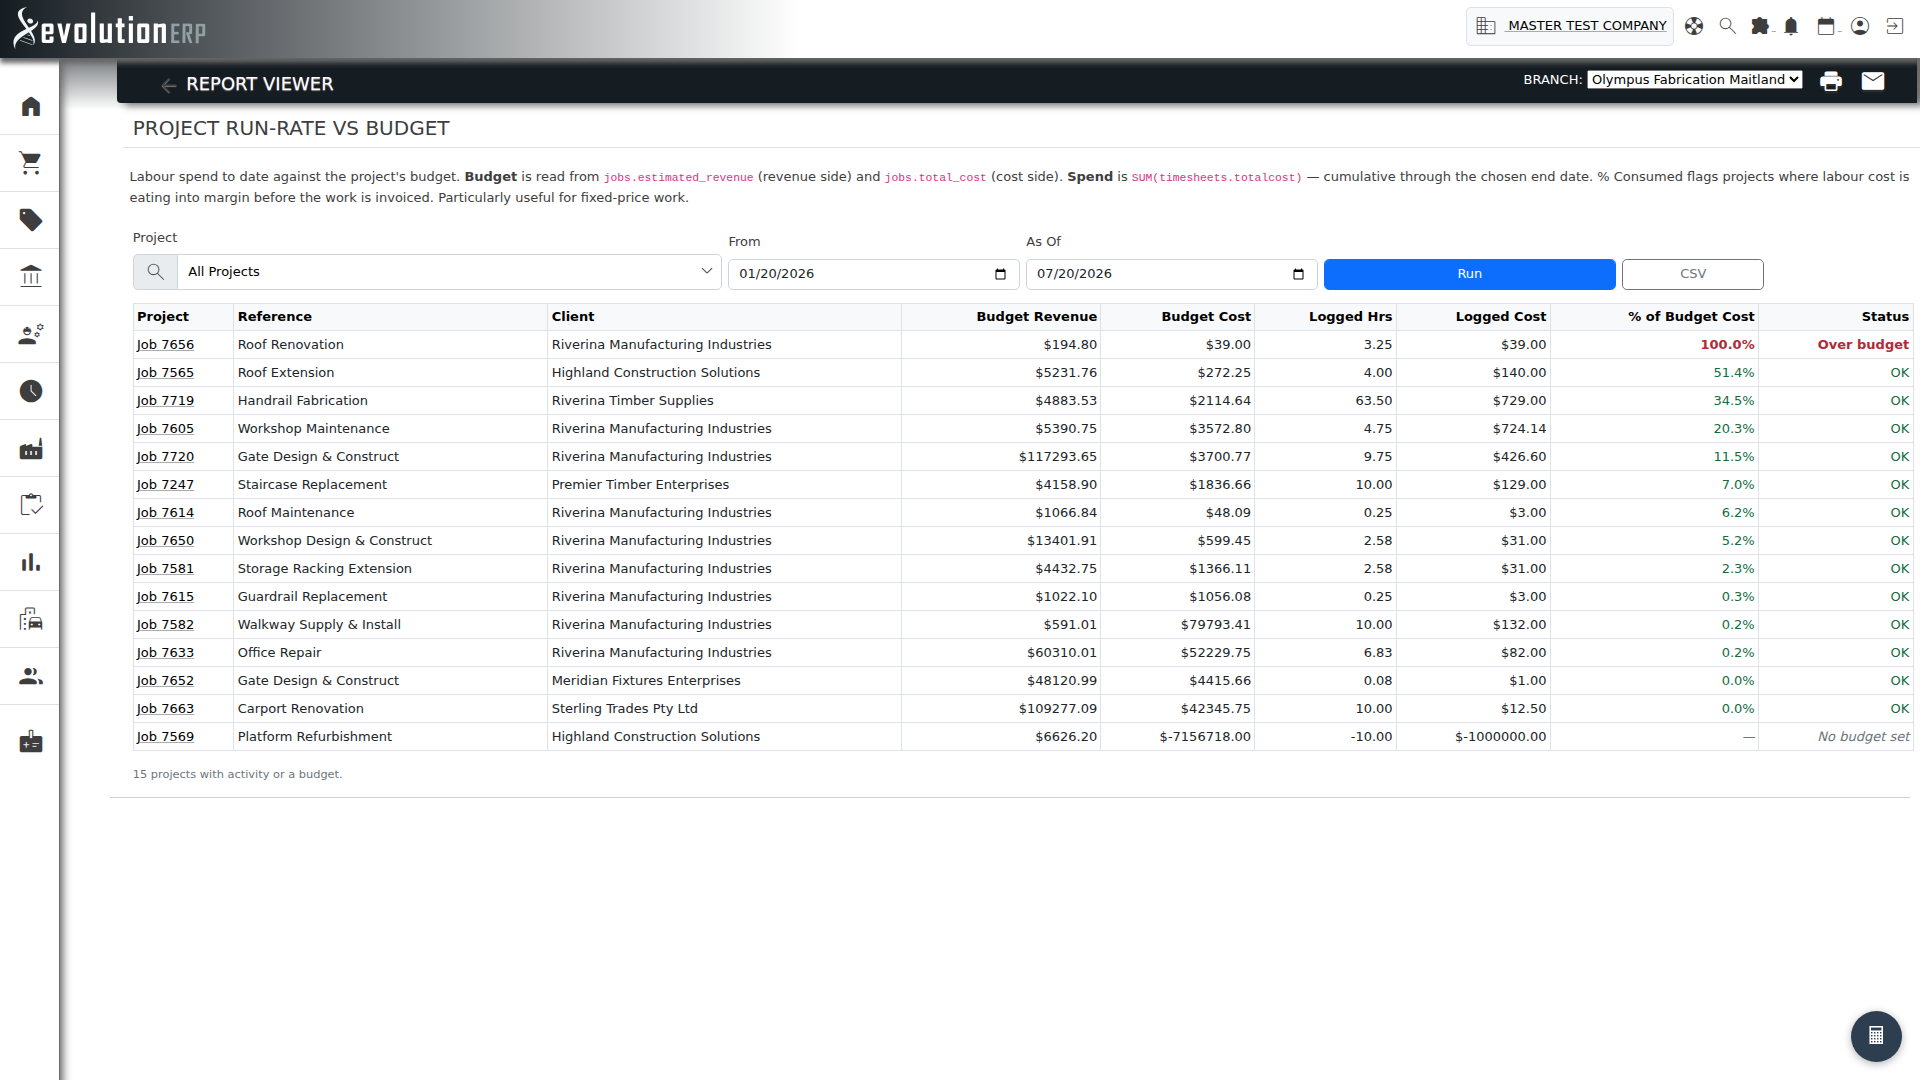
Project Run-Rate vs Budget
What it shows: Labour spend within the selected window against the project's budgeted revenue and cost. Every project is flagged with a status:
- OK — below 80% of budgeted cost.
- Tight — 80% or more (amber).
- Over budget — 100% or more (red).
- No budget set — the project has no budgeted cost to compare against.
How to use it: Particularly valuable for fixed-price work — the status badge surfaces budget erosion long before the project is closed and invoiced.
info Spend is totalled over the selected date range (the report defaults to the last six months), not cumulatively since the project started. To judge a long-running fixed-price project against its whole-of-life budget, widen the date range to cover the project from its start.
Utilisation
Is the team productive enough to hit margin?
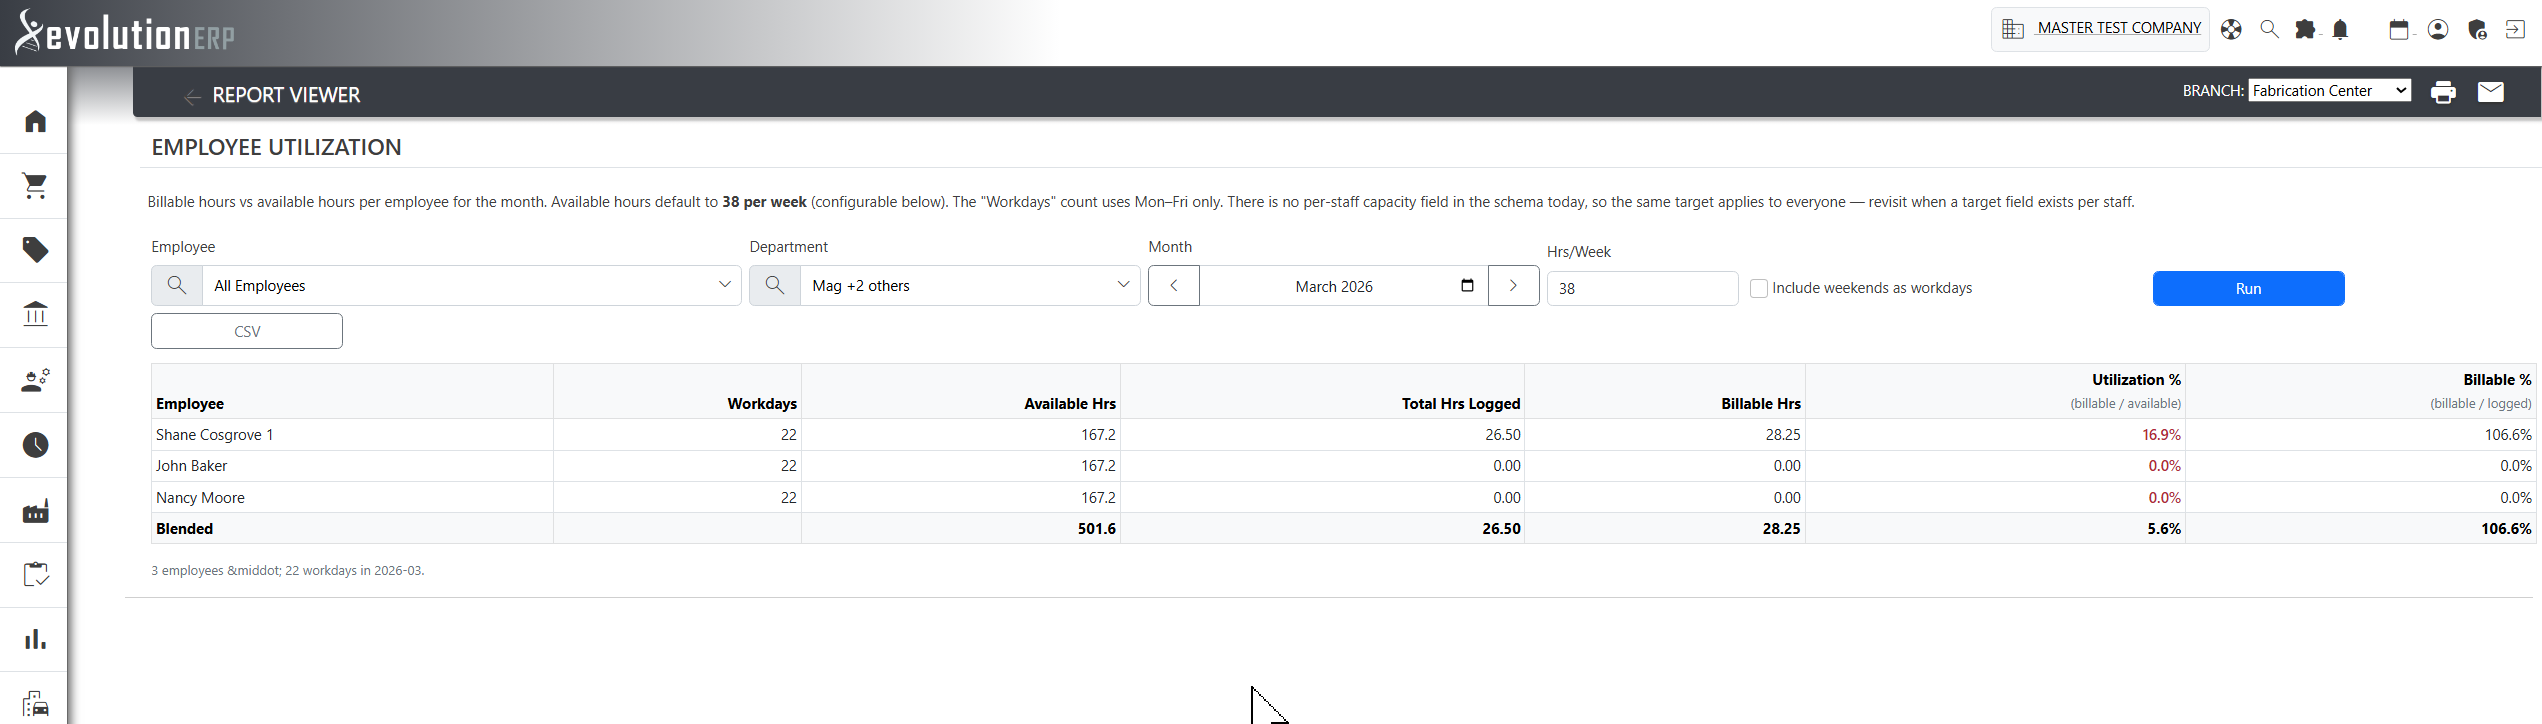
Employee Utilization
What it shows: Billable hours vs available hours per employee for the month, with two key %s:
- Utilization % — billable hours / available hours. Colour-graded: green ≥ 75%, amber 50–75%, red < 50%.
- Billable % — billable hours / hours logged. Indicates the proportion of recorded time that was billable.
How to use it:
- Pick the month using the chevron buttons or month picker.
- Adjust the Hrs/Week field for part-time staff or longer working weeks.
- Tick Include weekends as workdays for businesses that work weekends.
- The colour grading makes your top and bottom performers obvious at a glance.
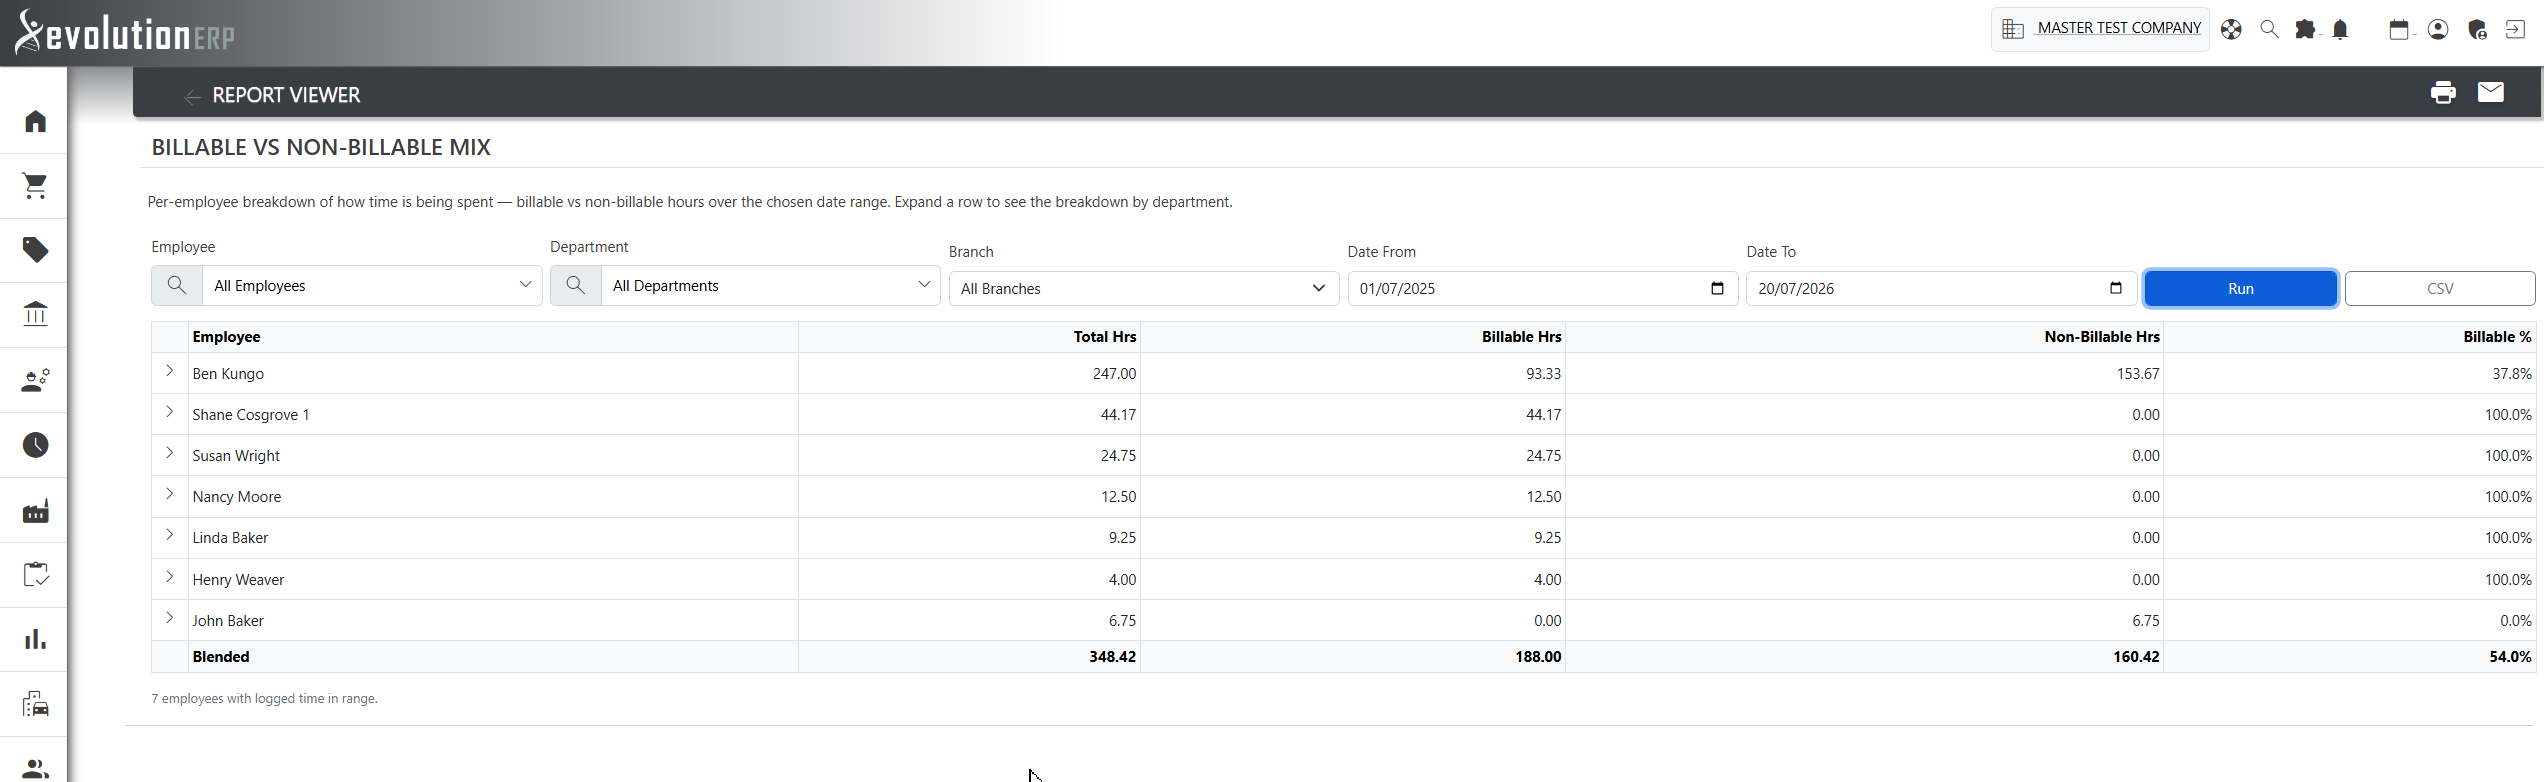
Billable vs Non-Billable Mix
What it shows: Per-employee breakdown of how time is being spent — billable vs non-billable hours over a date range.
How to use it: Click the chevron on an employee row to drill into a per-department breakdown — useful for seeing where non-billable time is going (admin, internal projects, training, etc.).
Compliance & Data Quality
Can we trust the numbers above?
The reports above are only useful if the timesheet data underneath them is complete and approved. These two reports keep the input clean.
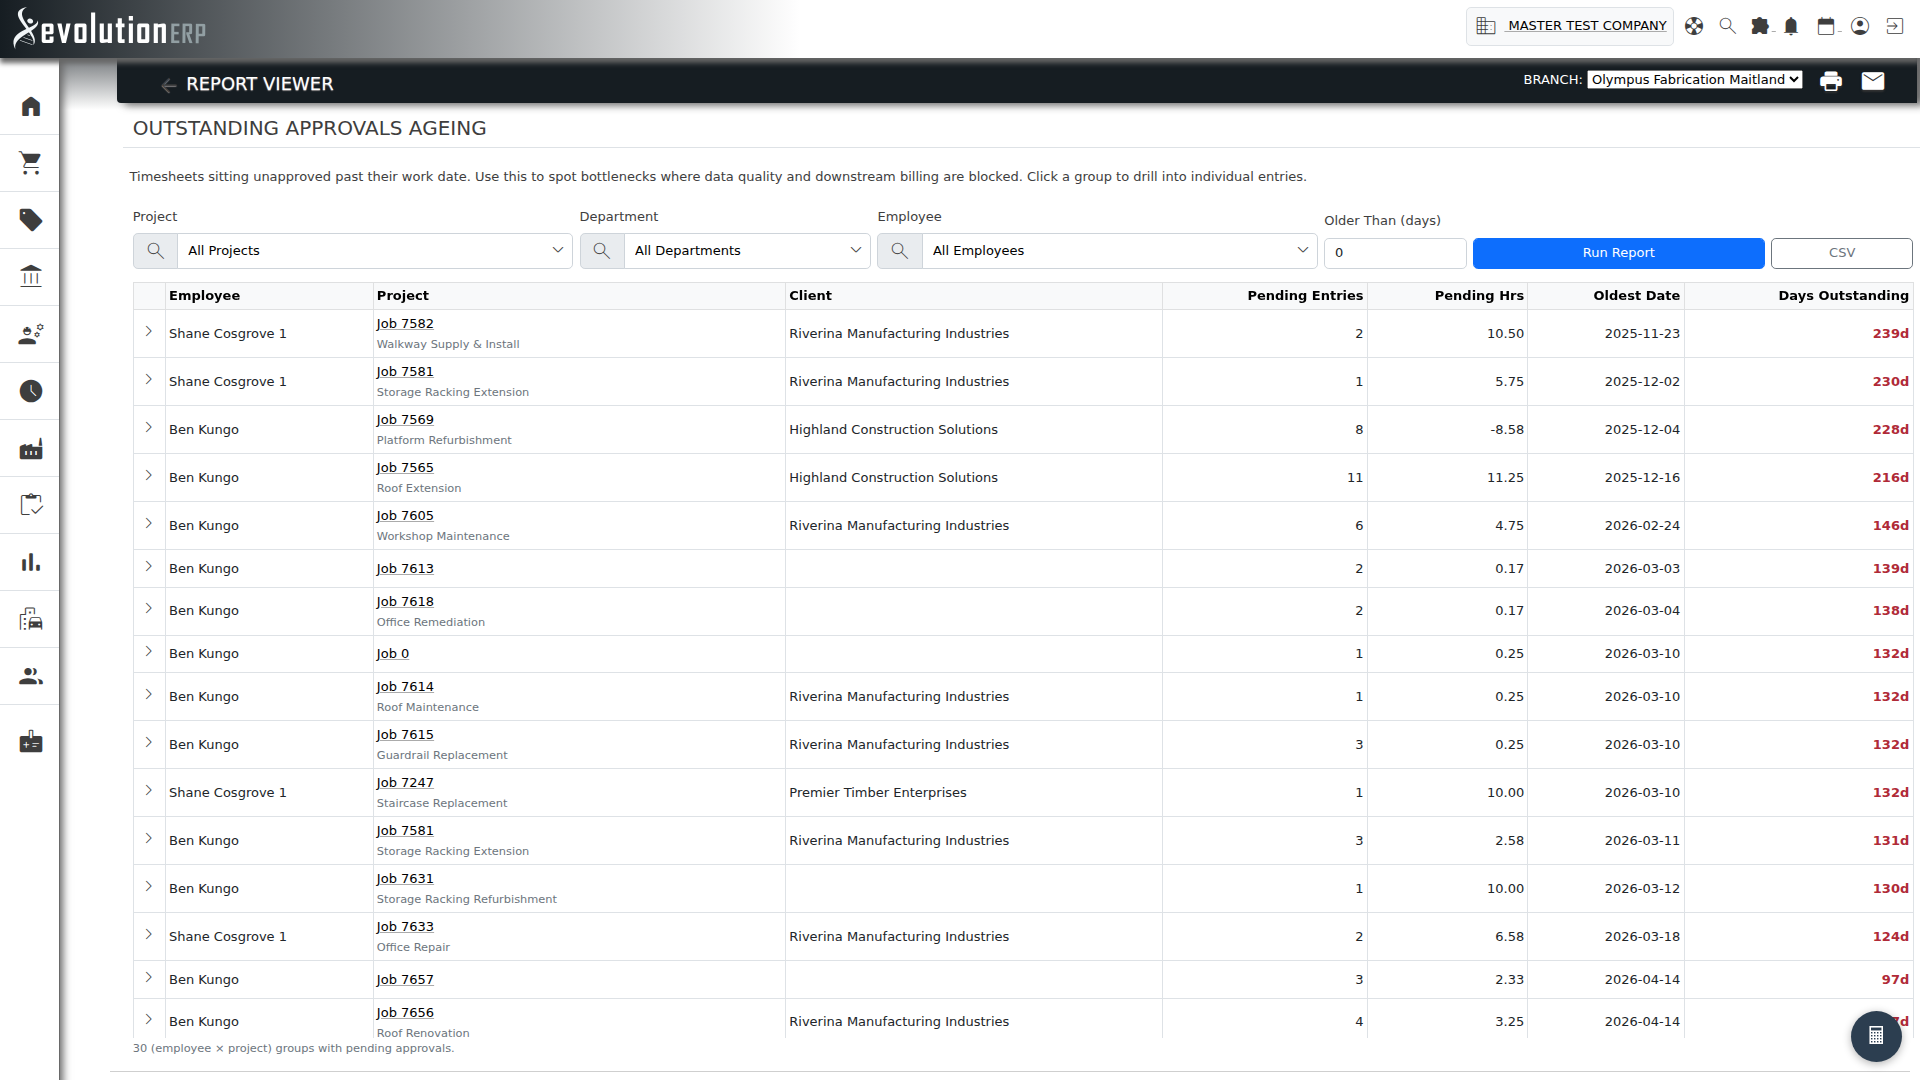
Outstanding Approvals Ageing
What it shows: Timesheets pending approval past their work date, grouped by employee + project. Days outstanding turn amber at 7 days and red at 14.
How to use it:
- Adjust the Older Than (days) field to focus on the truly stale entries.
- Filter by Employee or Project to drill into a specific manager's queue.
- Click the chevron on a row to see the individual unapproved entries.
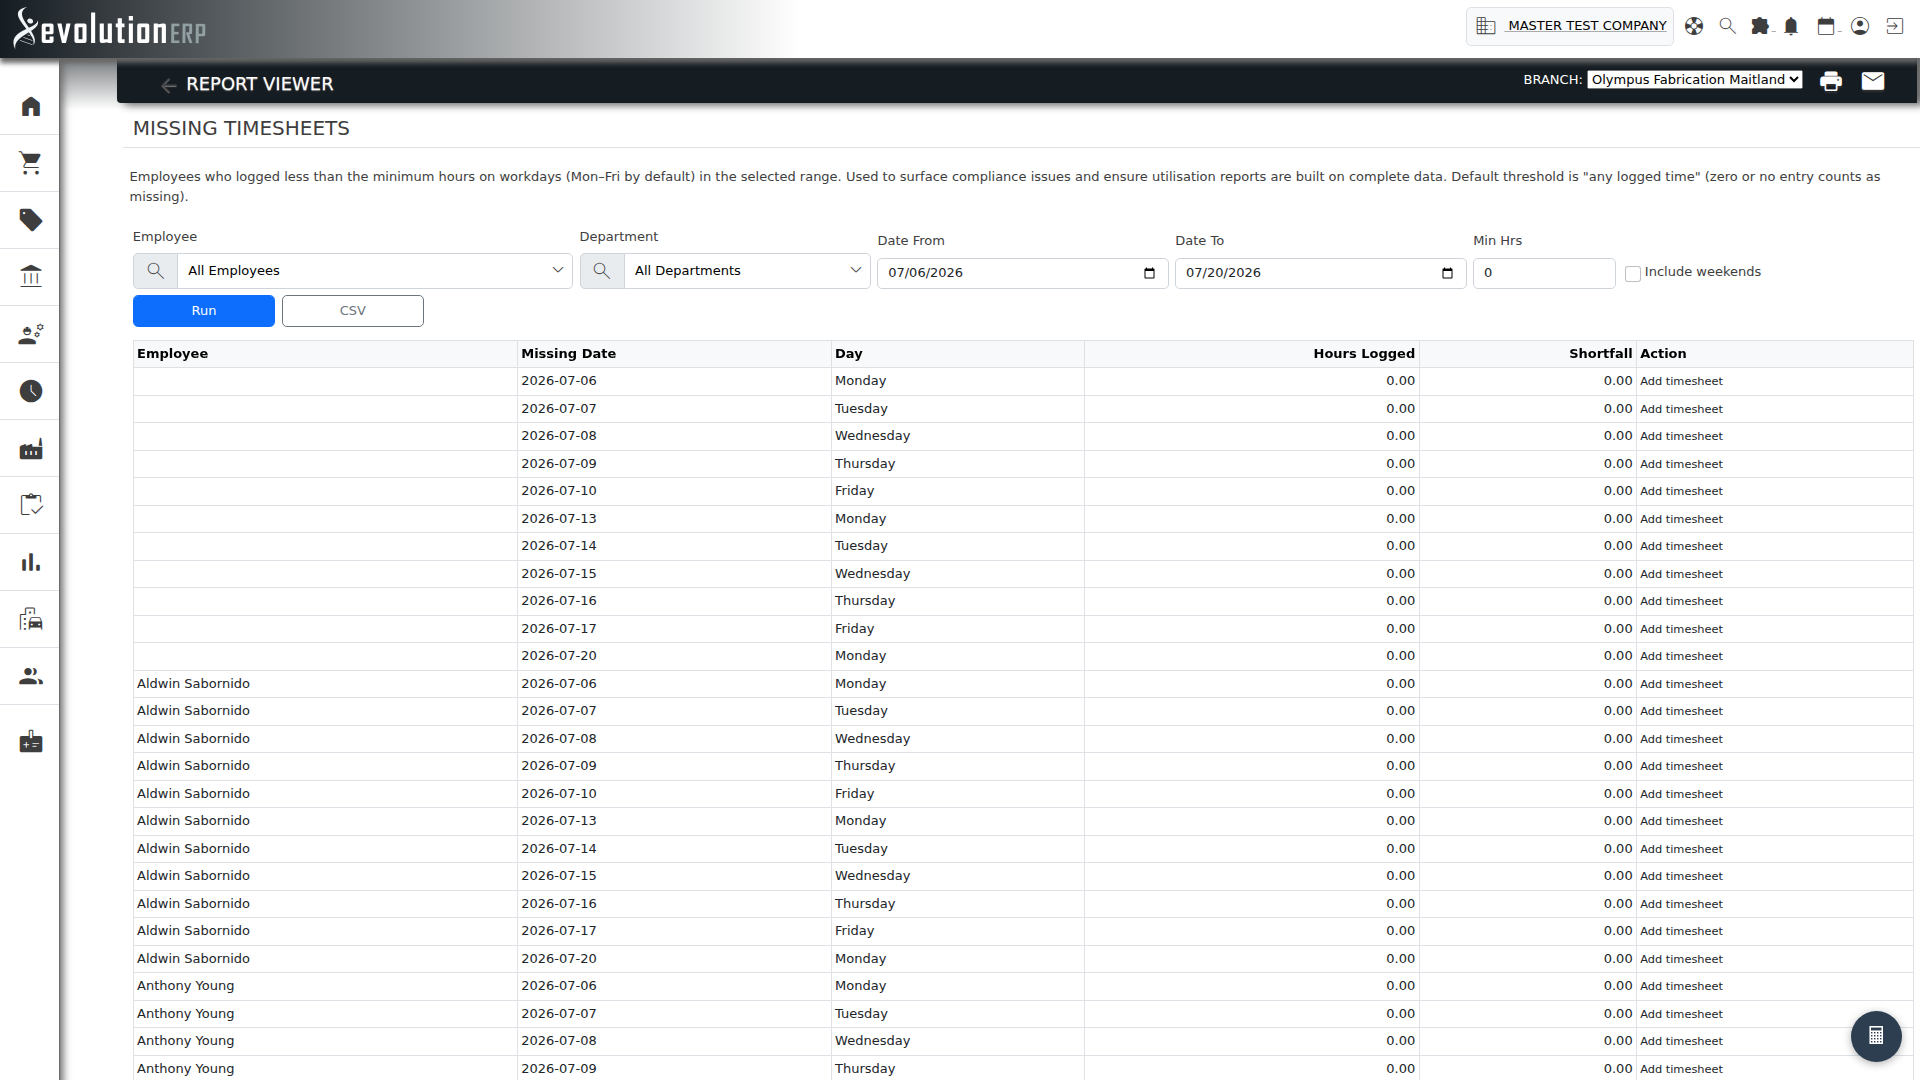
Missing Timesheets
What it shows: Employees who logged less than the threshold hours on workdays (Monday–Friday by default).
How to use it:
- Pick the date range — the report defaults to the last 14 days and accepts a span of up to 90 days per run.
- Set Min Hrs to define what counts as missing (default 0 — only days with no entry at all).
- Tick Include weekends for businesses that work weekends.
- Filter by Department to restrict the report to staff who have logged time to that department in the last 180 days.
- Each missing day links to Add timesheet so managers can chase entries in two clicks.
Tips
- Run Missing Timesheets and Outstanding Approvals Ageing first — the other reports are only as accurate as the data they read from.
- For monthly reviews, the workflow is typically: Approvals Ageing → Monthly Billing → Unbilled WIP Ageing → Project Labour Margin.
- For team management, Employee Utilization is the headline KPI — review monthly with your leadership team.
- Every report includes a CSV download so reports can be shared with stakeholders who don't have access to Evolution.