Where to Find Them
Menu → Reports → Reports Dashboard, then the Inventory pill (search “manufacturing” to list them together). Each report is also a tile on the Manufacturing Command Centre, and the KPI, demand and load reports have a Command Centre button to return there. These reports are not split by branch.
The Reports
Factory Activity Board
What it shows: a live view of the shop floor with one row per factory worker. Each row shows their status (Running, Stale, Paused or Off floor), the shop orders and processes they are working on, when they last touched the workbench, time banked in the current session, and today’s hours and quantity.
How to use it: leave it open with Auto-refresh ticked. Stale sessions sort to the top. Use the Session Manager button to resolve them. See Factory Sessions for the full guide.
Production KPIs
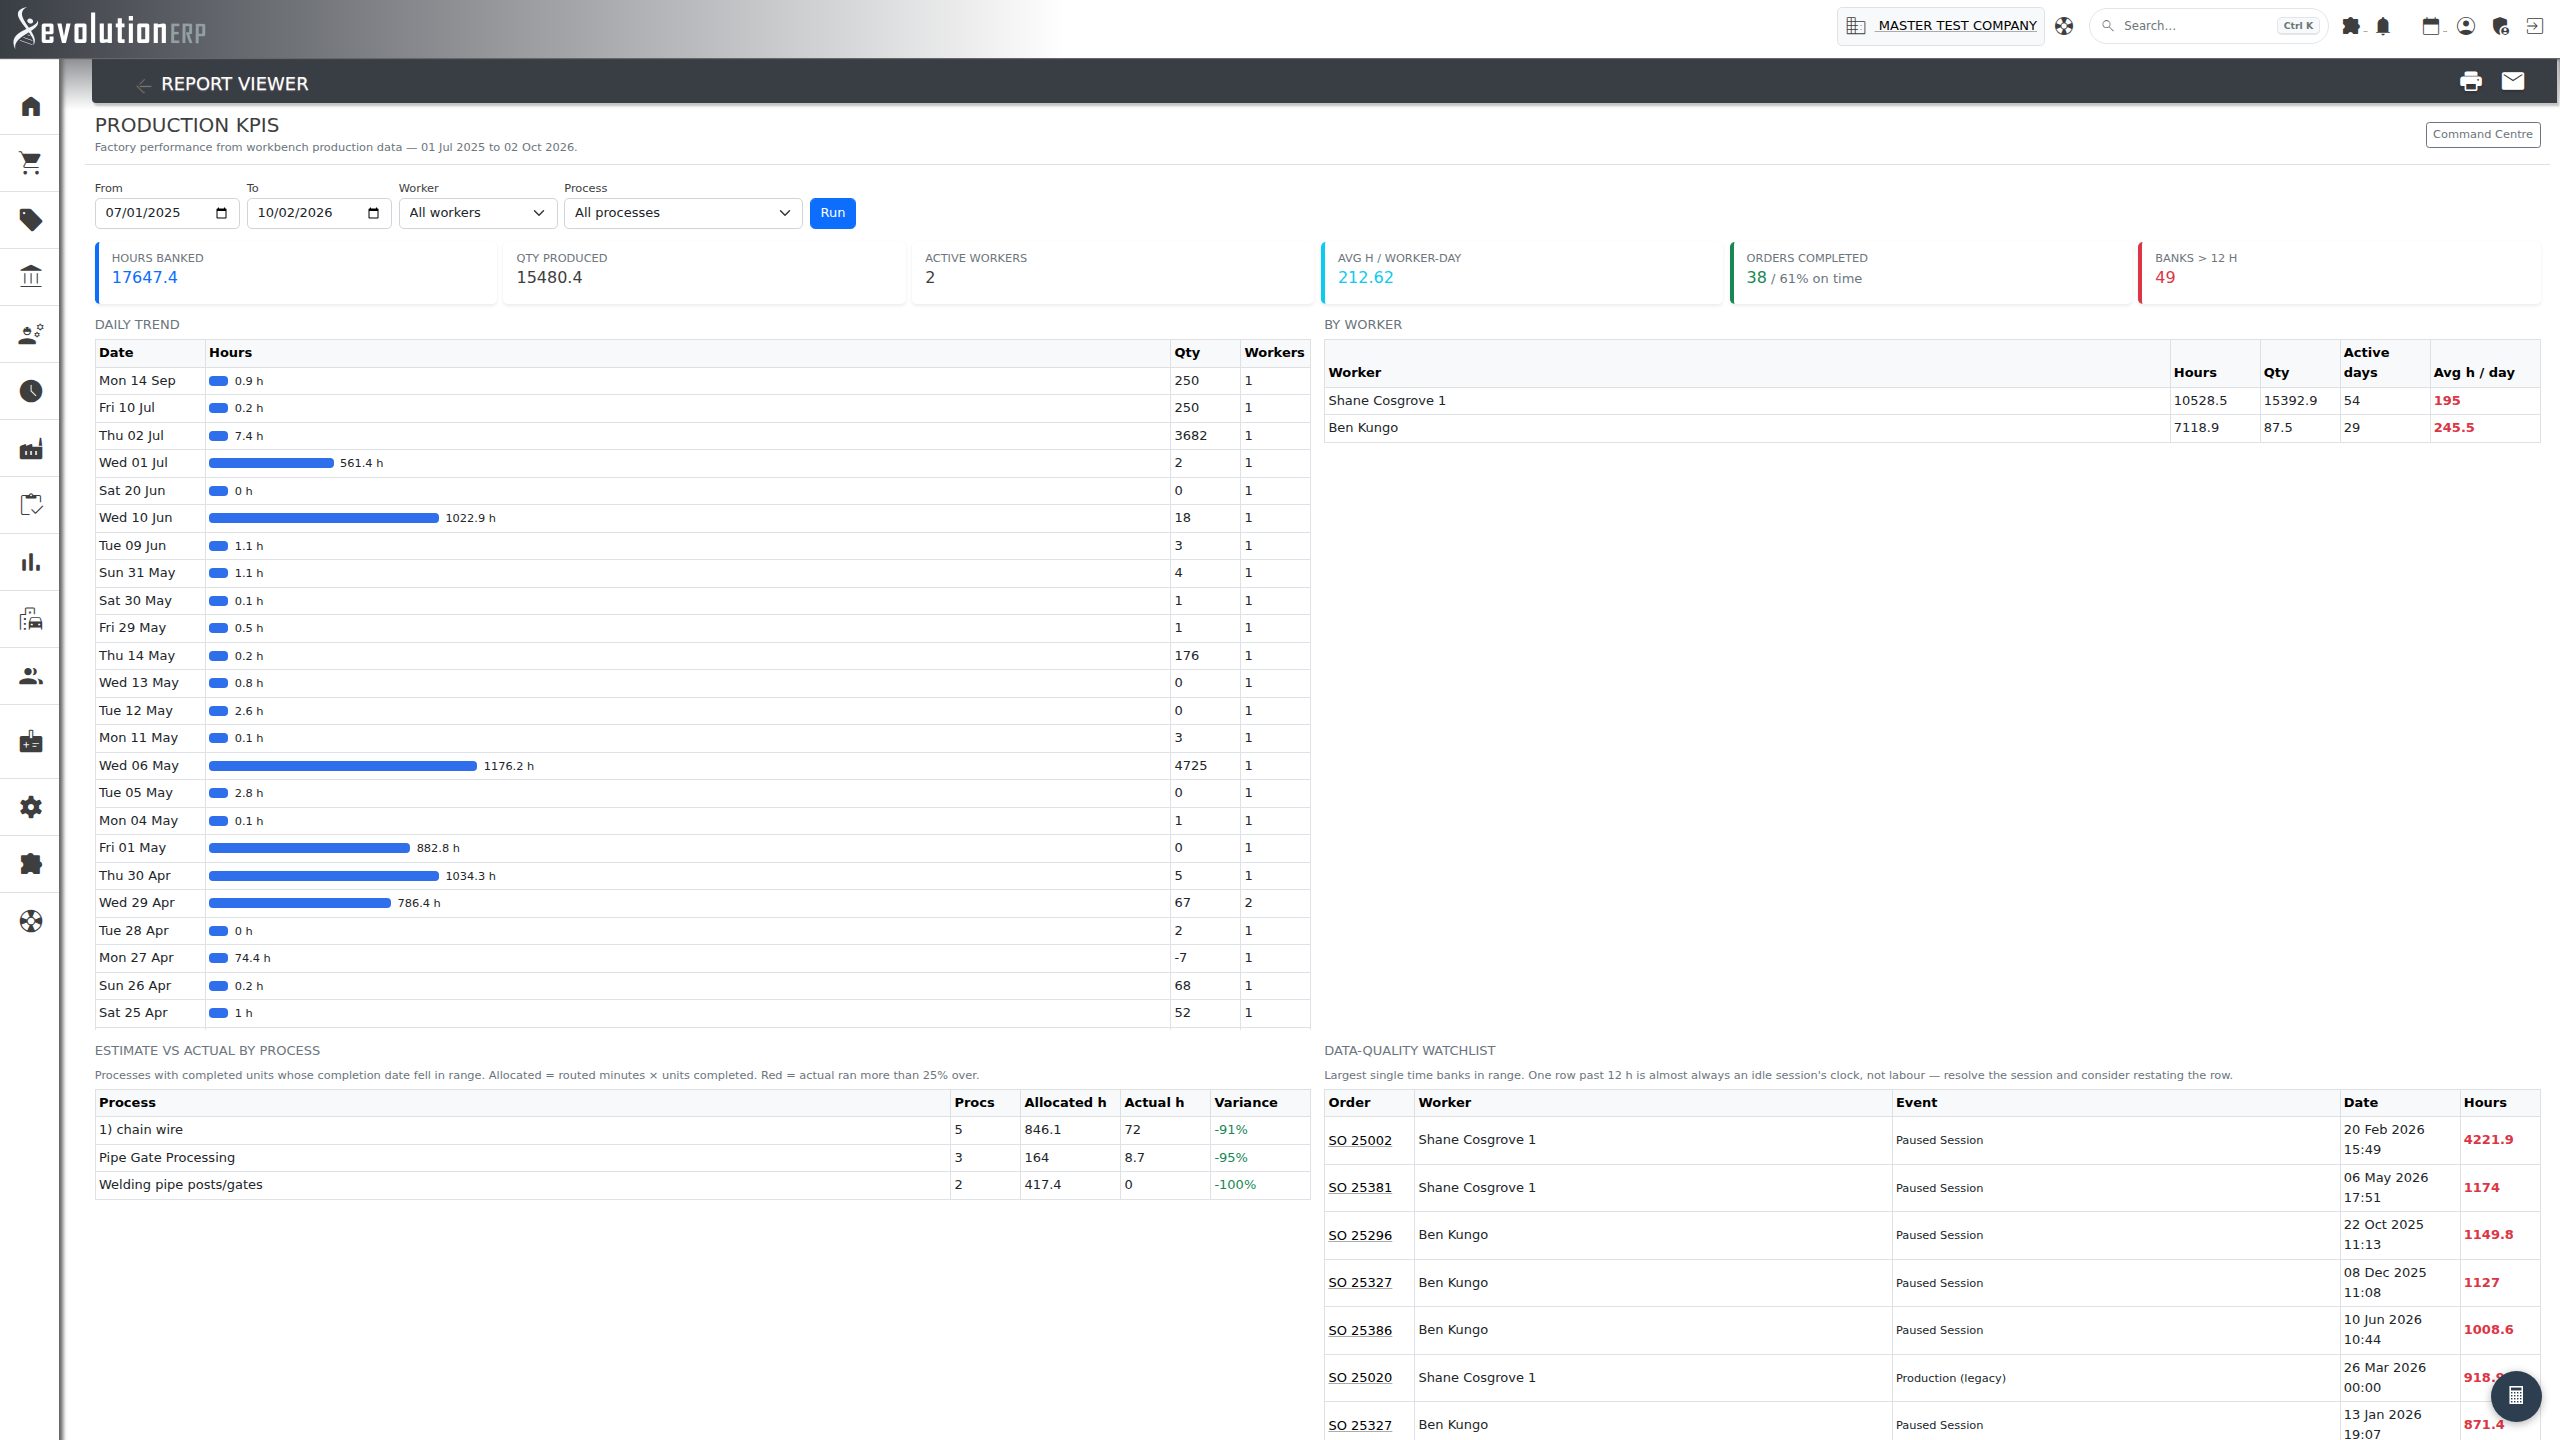
What it shows: factory performance from workbench production data over a date range (the last four weeks by default). Figures across the top show hours banked, quantity produced, active workers, average hours per worker-day, orders completed and the share completed on time, the number of single time entries over 12 hours, and how many sessions were auto-paused.
- Daily trend: hours, quantity and workers for each day.
- By worker: hours, quantity, active days and average hours per day. An average over 12 hours a day is shown in red, because it almost always means idle session time rather than labour.
- Estimate vs actual by process: for processes that completed units in the range, the time allocated by the route (minutes per unit × units completed) against the actual time banked. Red means actual ran more than 25% over.
- Data-quality watchlist: the largest single time entries over 12 hours, linked to their shop orders. These are usually a forgotten session’s clock, not real work. Resolve the session in the Session Manager and turn on auto-pause to stop them recurring.
How to use it: set From / To, and optionally a worker or process, then click Run.
Production Demand Schedule
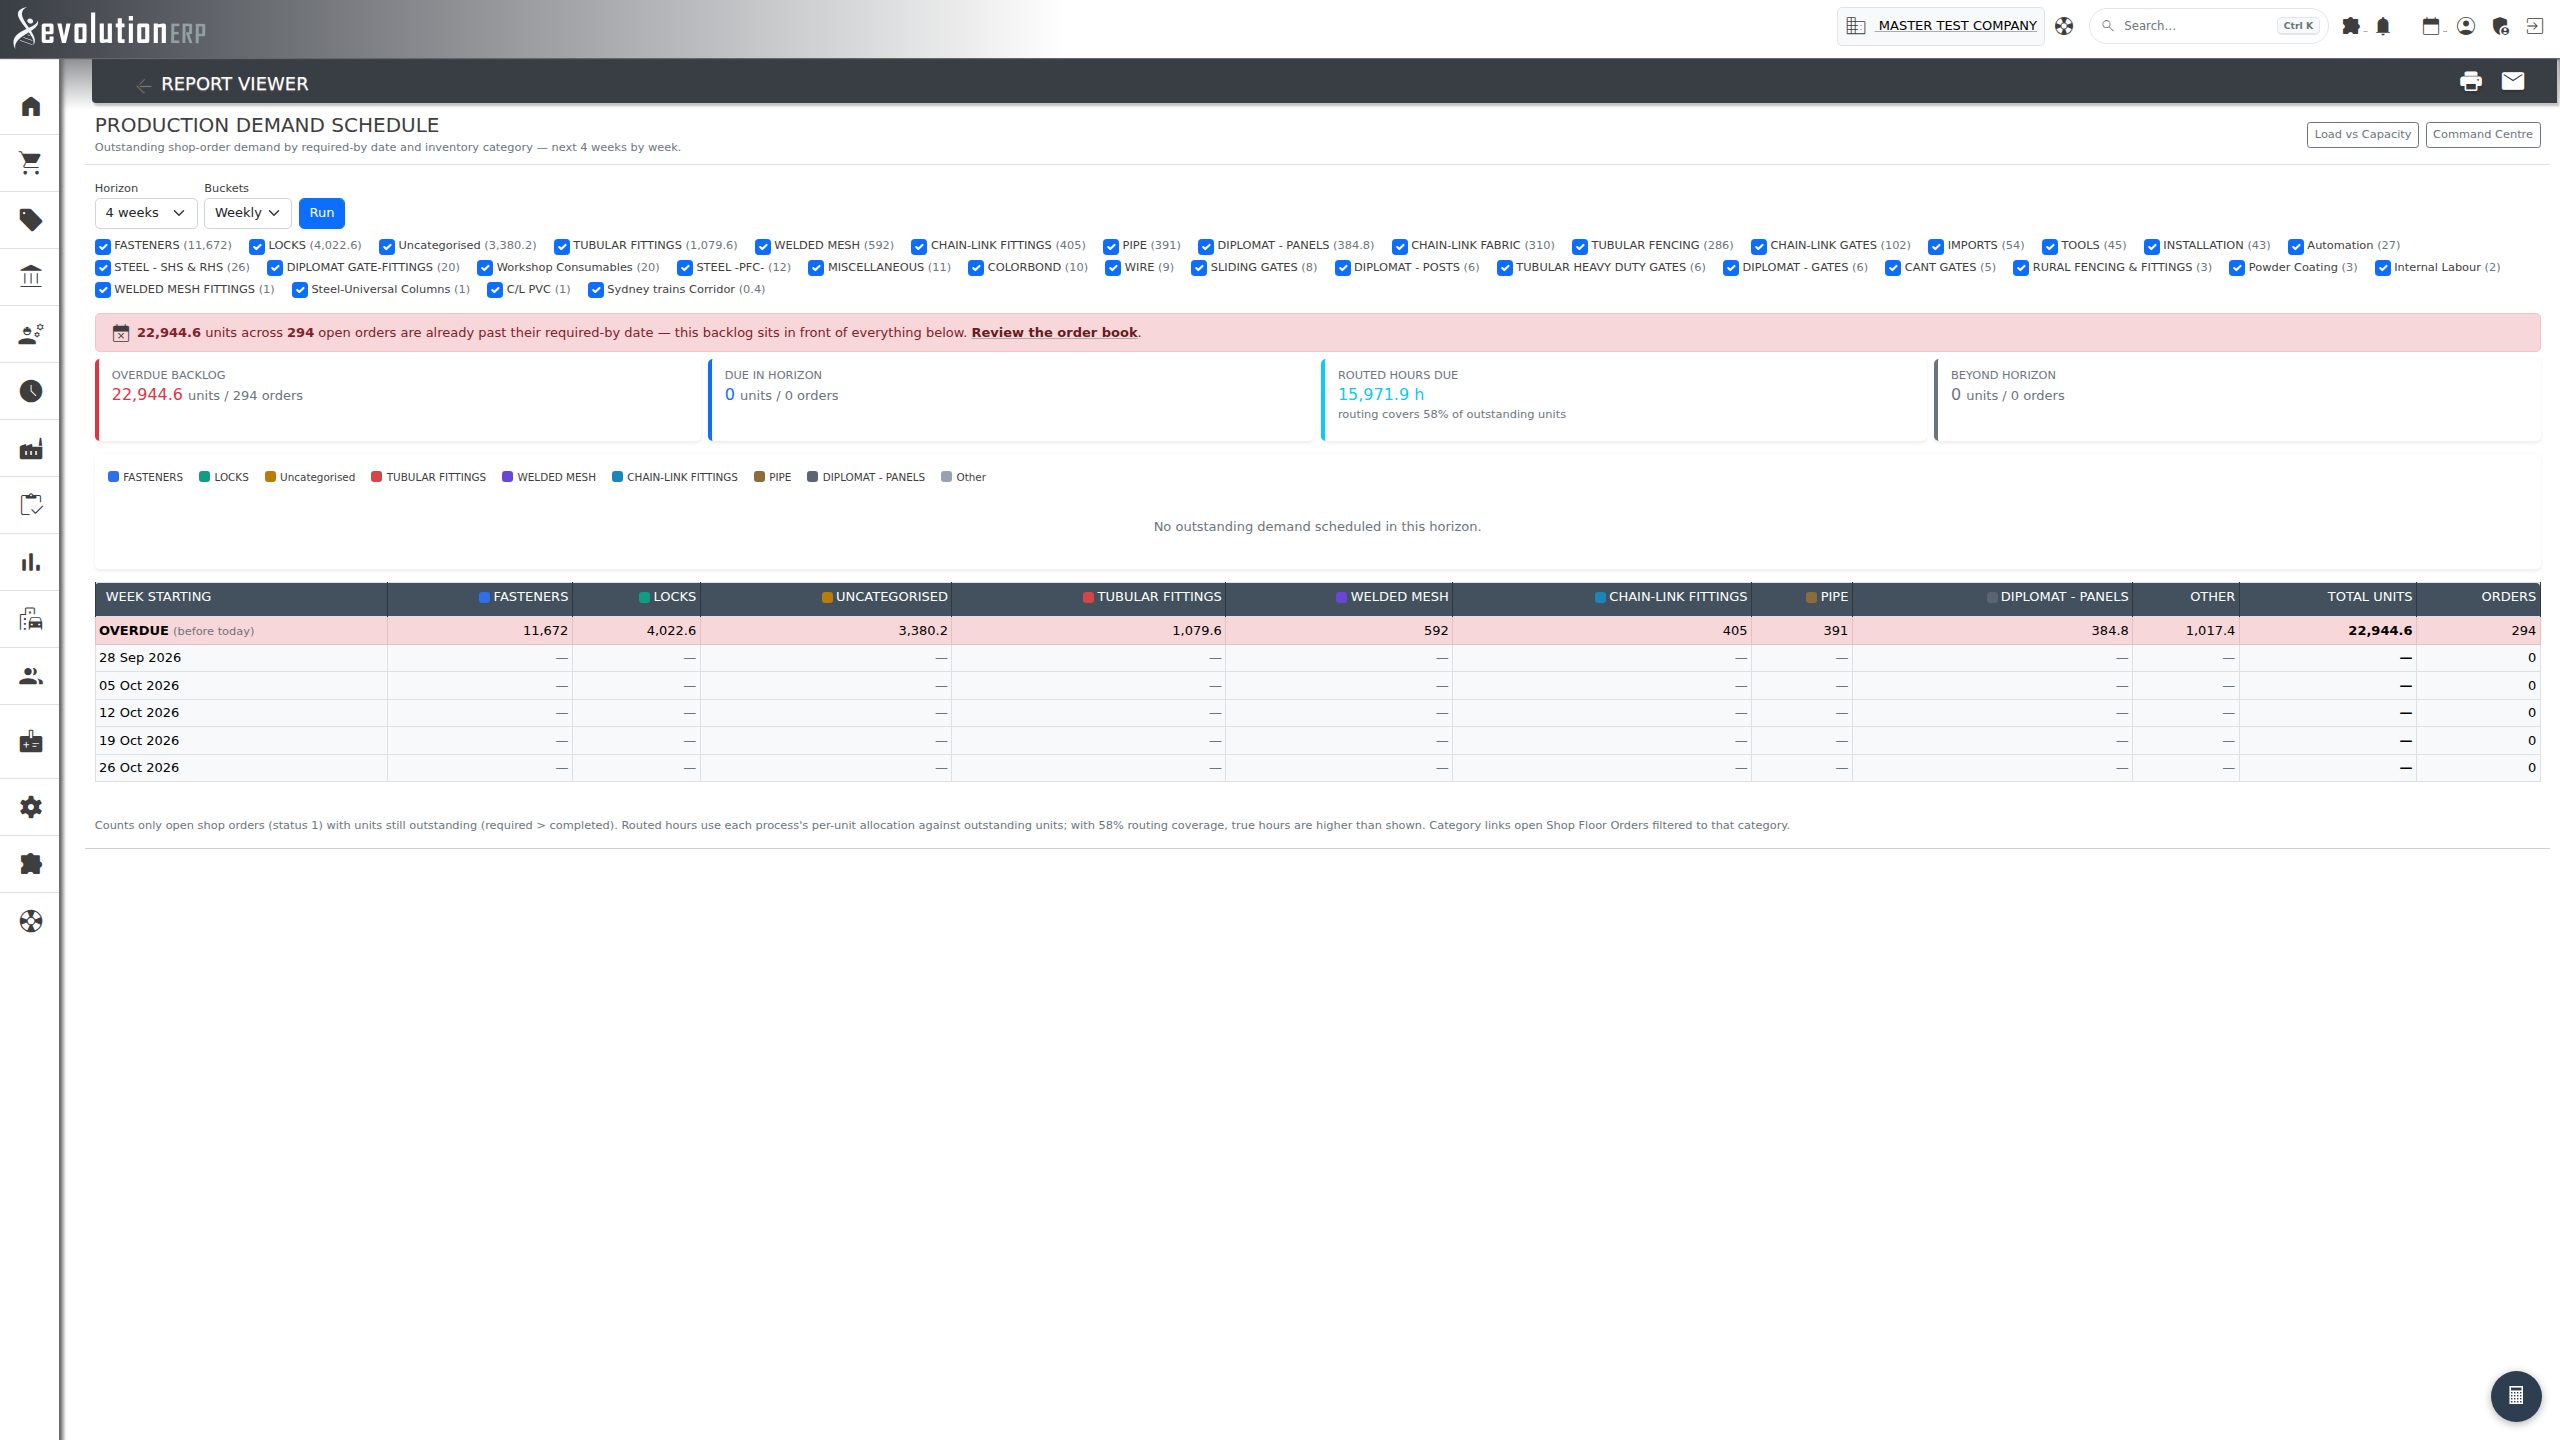
What it shows: outstanding demand on open shop orders (units still to complete) by required-by date and inventory category. Overdue work is not dropped: an OVERDUE row comes first, and a warning lists any open orders with no required-by date, because those appear in no schedule until they are dated. Figures across the top total the overdue backlog, what is due in the horizon, what falls beyond it, and the routed hours due.
- Choose a Horizon of 2, 4, 8 or 13 weeks, and Weekly or Daily buckets. Untick categories to leave them out.
- A stacked bar per period shows the top categories, with the rest grouped as Other. The table below gives exact units per category.
- Click a category to open Shop Floor Orders filtered to it.
info Routed hours count only units whose route has process time allocations. The report shows what share of outstanding units is covered. When coverage is below 100%, the true hours are higher than shown.
Factory Load vs Capacity
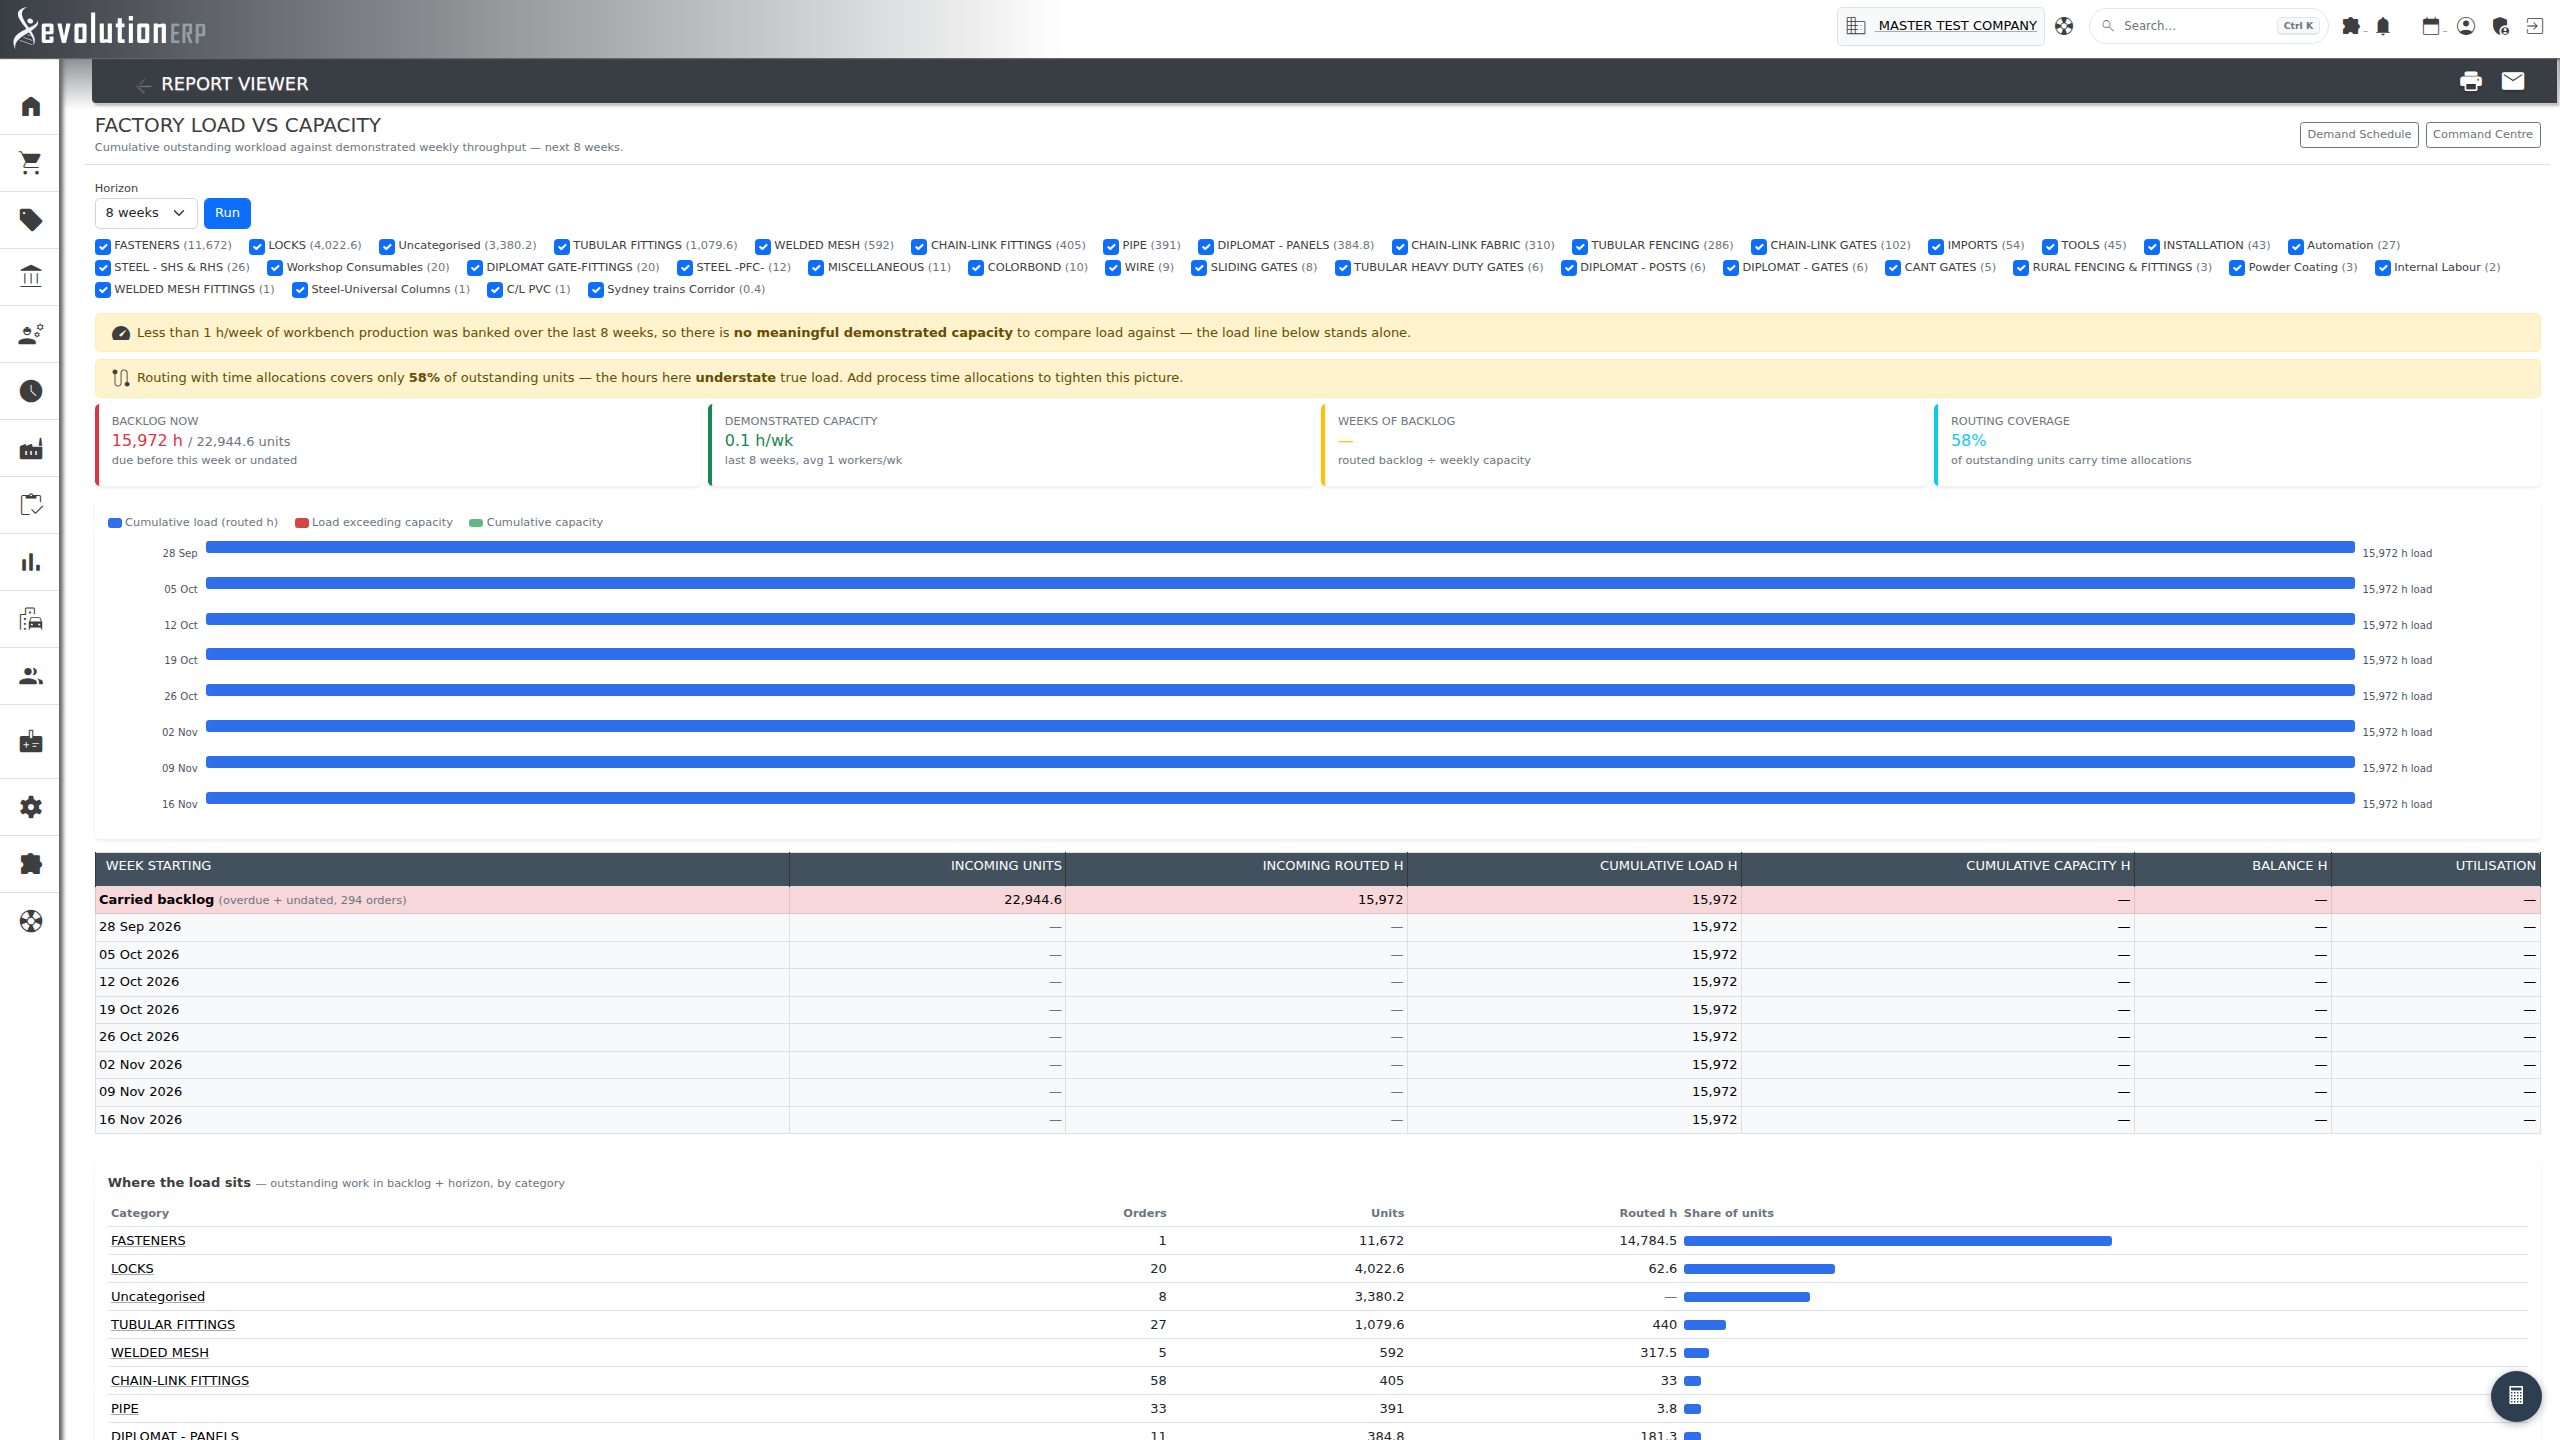
What it shows: whether the factory can keep up. It starts from the carried backlog (overdue and undated work), adds each week’s incoming routed hours, and compares the running total with the factory’s demonstrated capacity. Demonstrated capacity is the average production hours actually banked per week over the last 8 weeks, excluding single entries over 12 hours. Figures across the top show backlog hours, capacity per week, weeks of backlog and routing coverage.
- Bars compare cumulative load with cumulative capacity, and turn red where load runs ahead.
- The weekly table shows incoming units and hours, cumulative load and capacity, the balance, and utilisation.
- Where the load sits breaks outstanding work down by category.
info If less than 1 hour a week has been banked over the last 8 weeks (for example, while the workbench is still being rolled out), there is no meaningful capacity to compare against. The report says so and shows the load on its own. As with the demand schedule, low routing coverage means the load is understated.