
Where to Find Them
Menu → Reports → Reports Dashboard, then the Purchasing pill.
Purchasing reports require reporting access together with purchasing or general ledger access, or administrator access — if you don't see them, contact your administrator.
Each report runs in the browser with a Run button to refresh, a sortable, searchable table and a CSV button to export the current results. Money is summed from decimal columns, so the totals reconcile to the cent.
Demand & Re-order
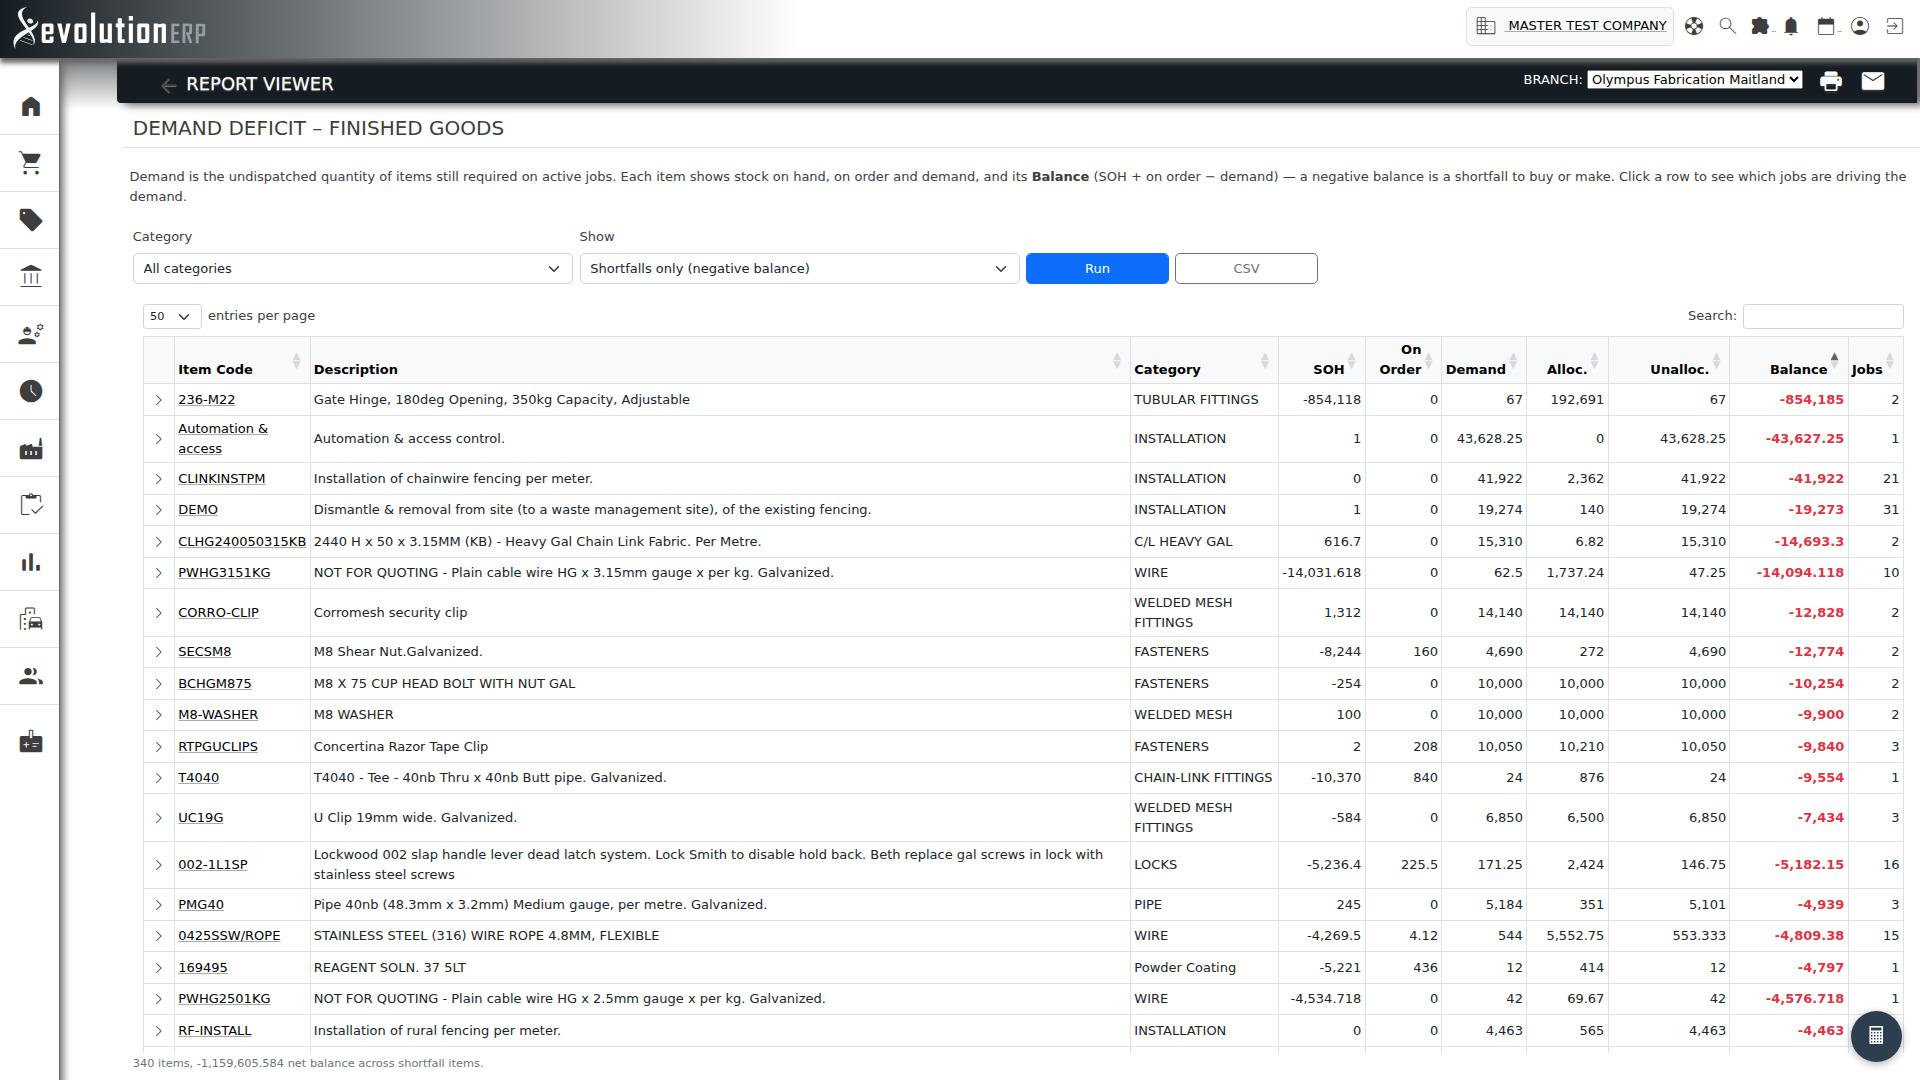
Demand Deficit – Finished Goods
What it shows: The undispatched quantity of items still required on active projects (demand), against stock on hand and on order. Each item's Balance (SOH + on order − demand) shows the shortfall to buy or make; click a row to expand a per-job breakdown of what's driving the demand.
How to use it: Filter by category and choose "shortfalls only" or all items with demand. Use it ahead of purchase or production planning to confirm what needs to be available, and export to CSV.
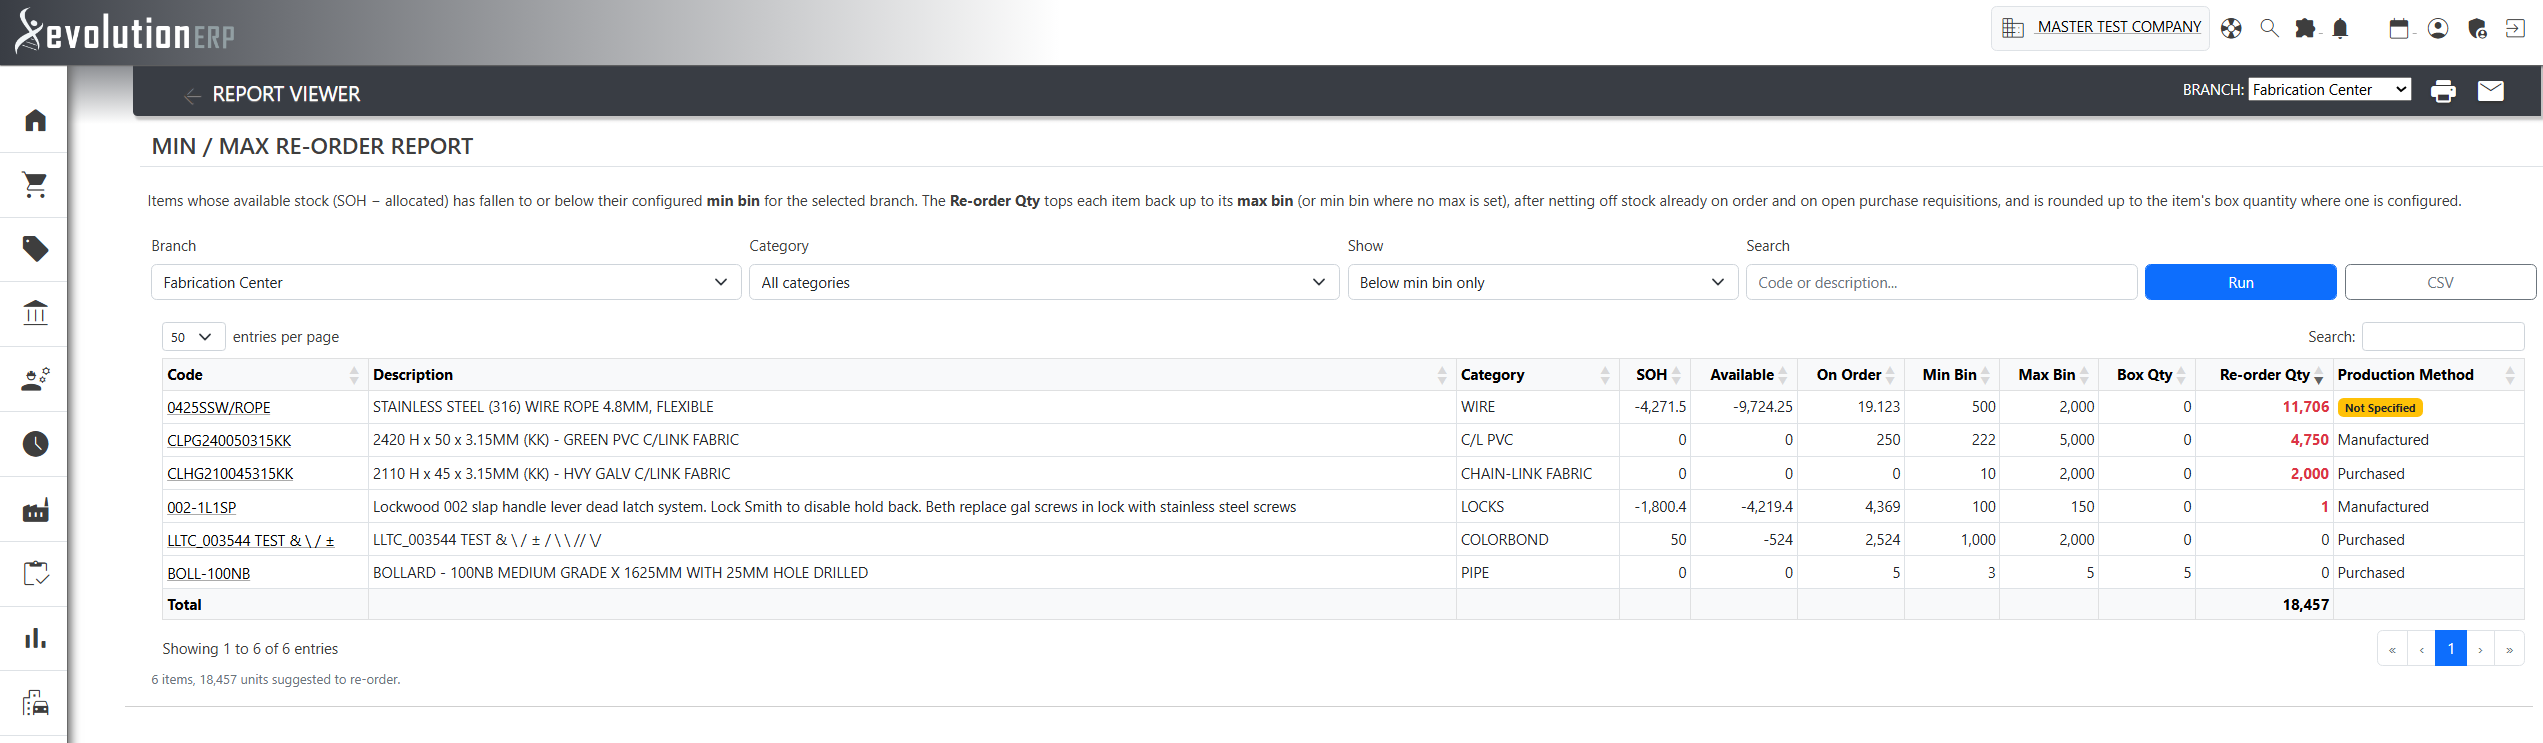
Min / Max Inventory Re-order Report
What it shows: Items whose available stock (SOH − allocated) has fallen to or below their configured min bin for the selected branch. The suggested Re-order Qty tops each item back up to its max bin (or its min bin where no max is set), after netting off stock already on order and on open purchase requisitions, and is rounded up to the item's box quantity where one is configured. Items with no production method set are flagged.
How to use it: Choose the branch, optionally narrow by category or search, and switch between "below min bin only" and all items with a min bin. Run it regularly to drive routine replenishment purchasing, and export to CSV to hand to buyers.
Inventory Re-order Insights
What it shows: For each item, over a chosen date range:
- Consumption — total stock used (dispatch / invoice / shop-floor draws as well as stocktake corrections and stock adjustments).
- Stock on hand across selected branches.
- Stock on order across selected branches.
- Total purchased — quantity ordered on POs raised in the date range.
How to use it:
- Filters — Category and Branch (multi-select), Date Range (max 12 months), and a free-text exclusion filter for products to drop out.
- Exclude zero consumption — tick this to hide items with no movements in the period.
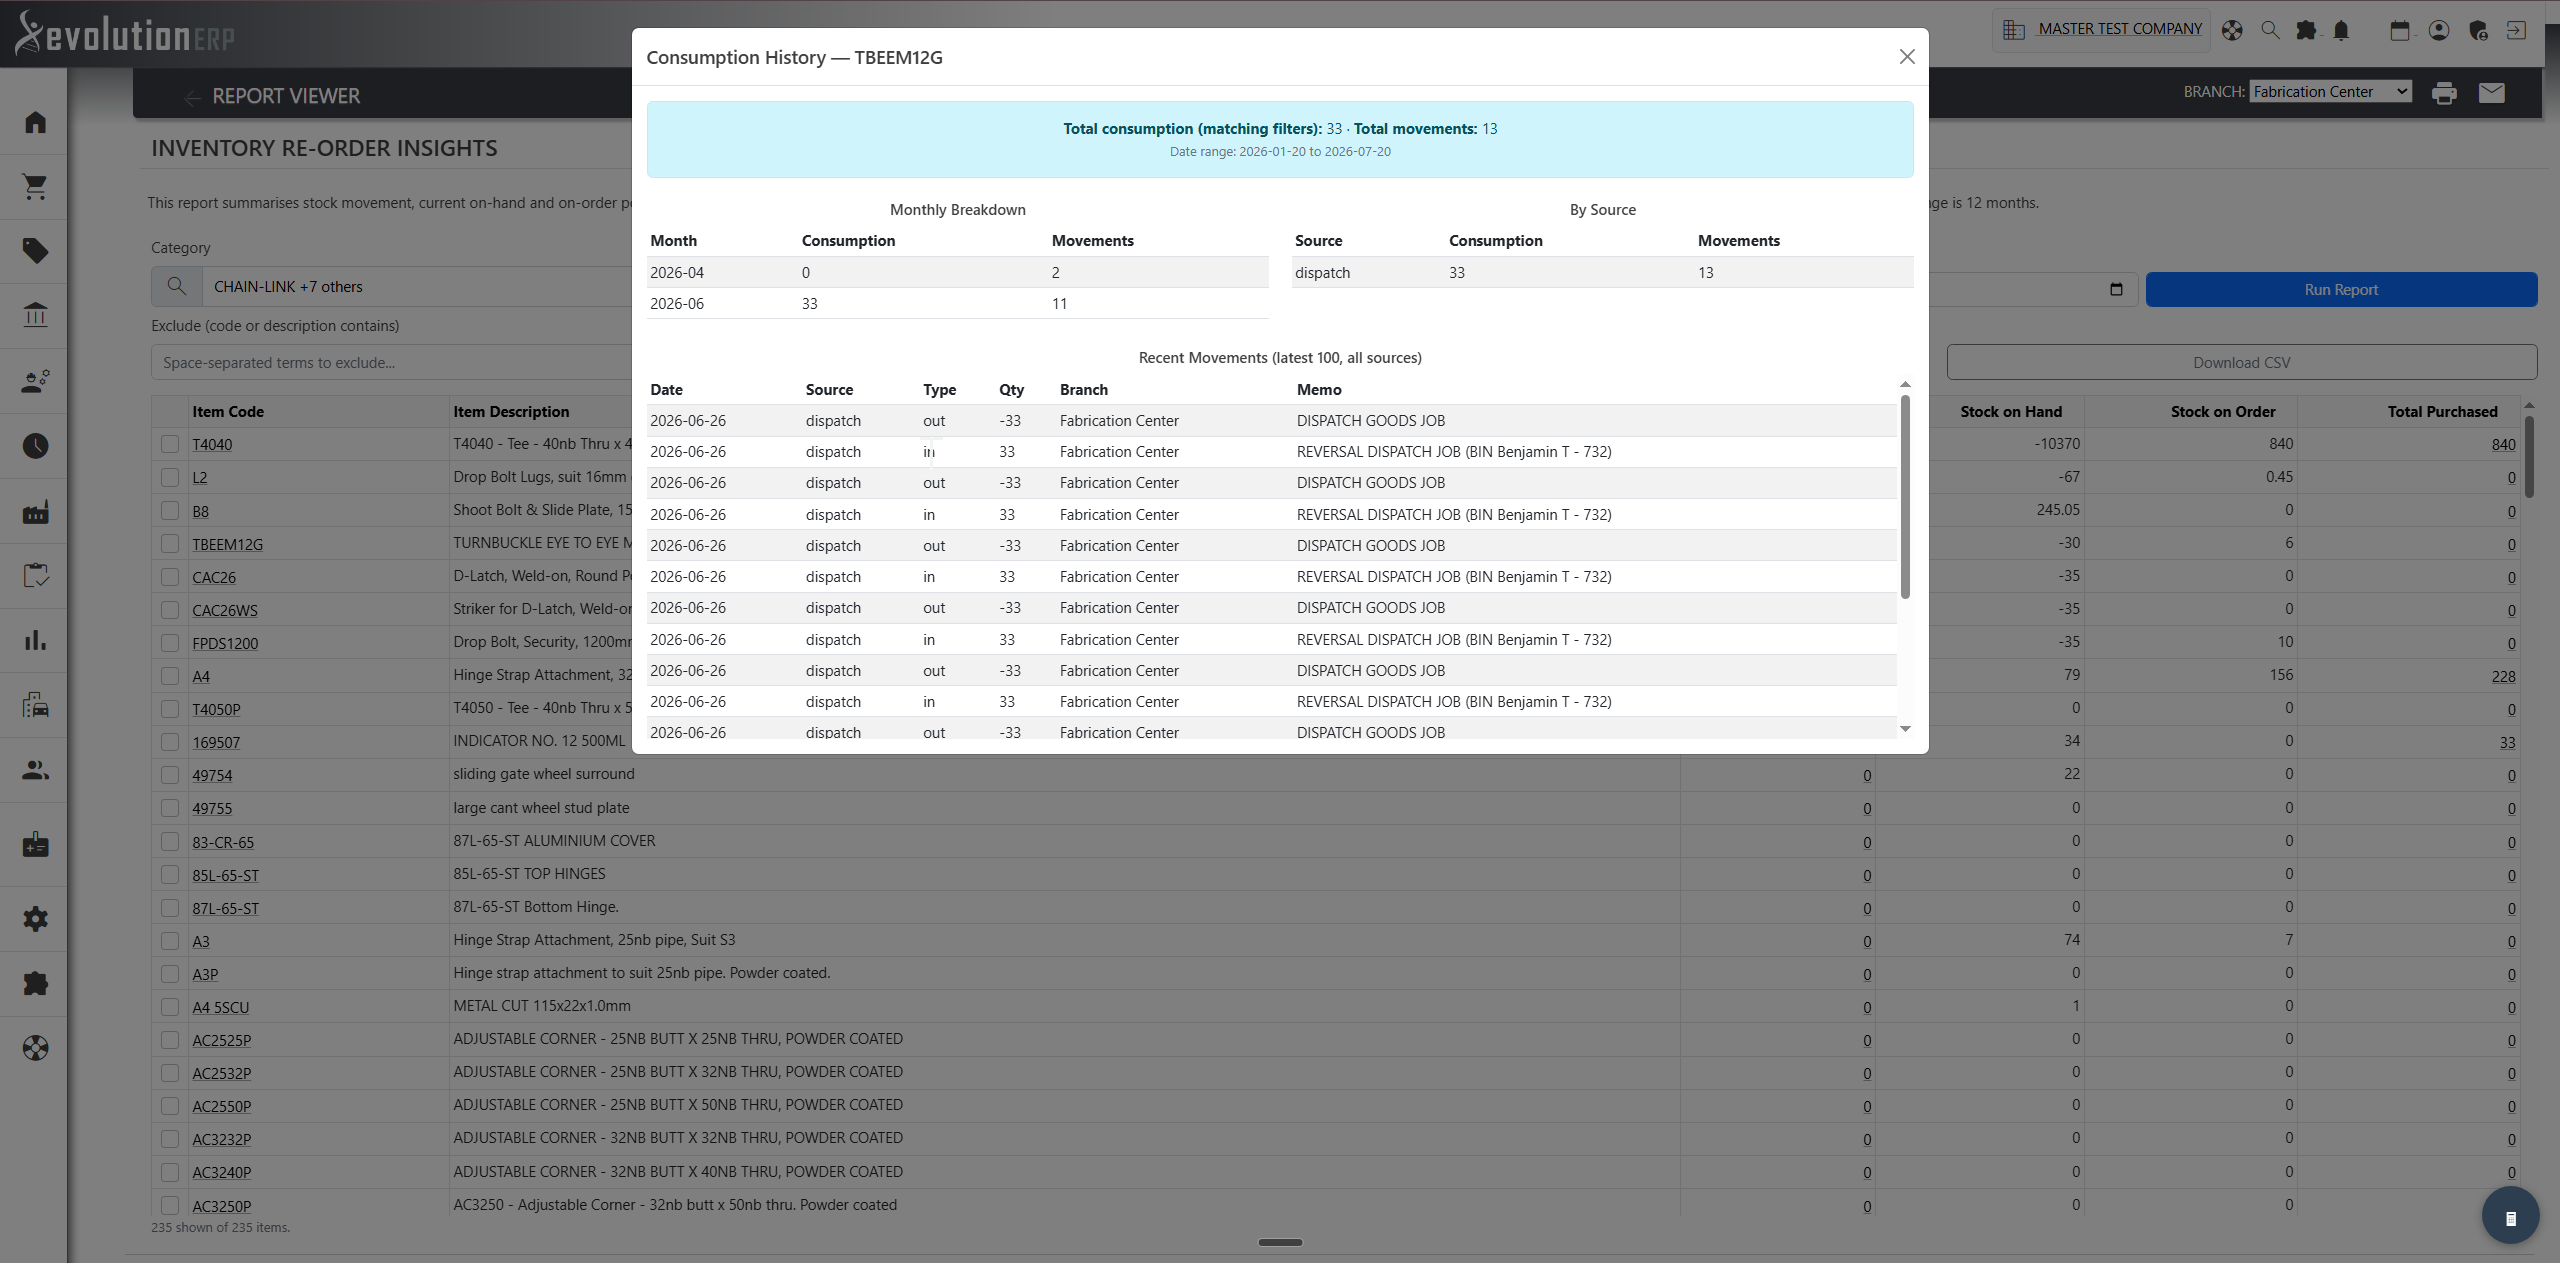
- Click the Consumption value on any row to open a drill-down modal with monthly breakdown, breakdown by movement source, and the 100 most recent stock movements for that item.
- Click the Total Purchased value on any row to open a drill-down modal listing every PO that contributed to the total — with click-through to the PO.
- Hide a row using the checkbox on the left while reviewing — use "Show all hidden rows" to bring them back.
- Download CSV of the visible rows for further analysis. The report returns up to 5,000 items — narrow by category if you hit the cap.
Purchase Orders
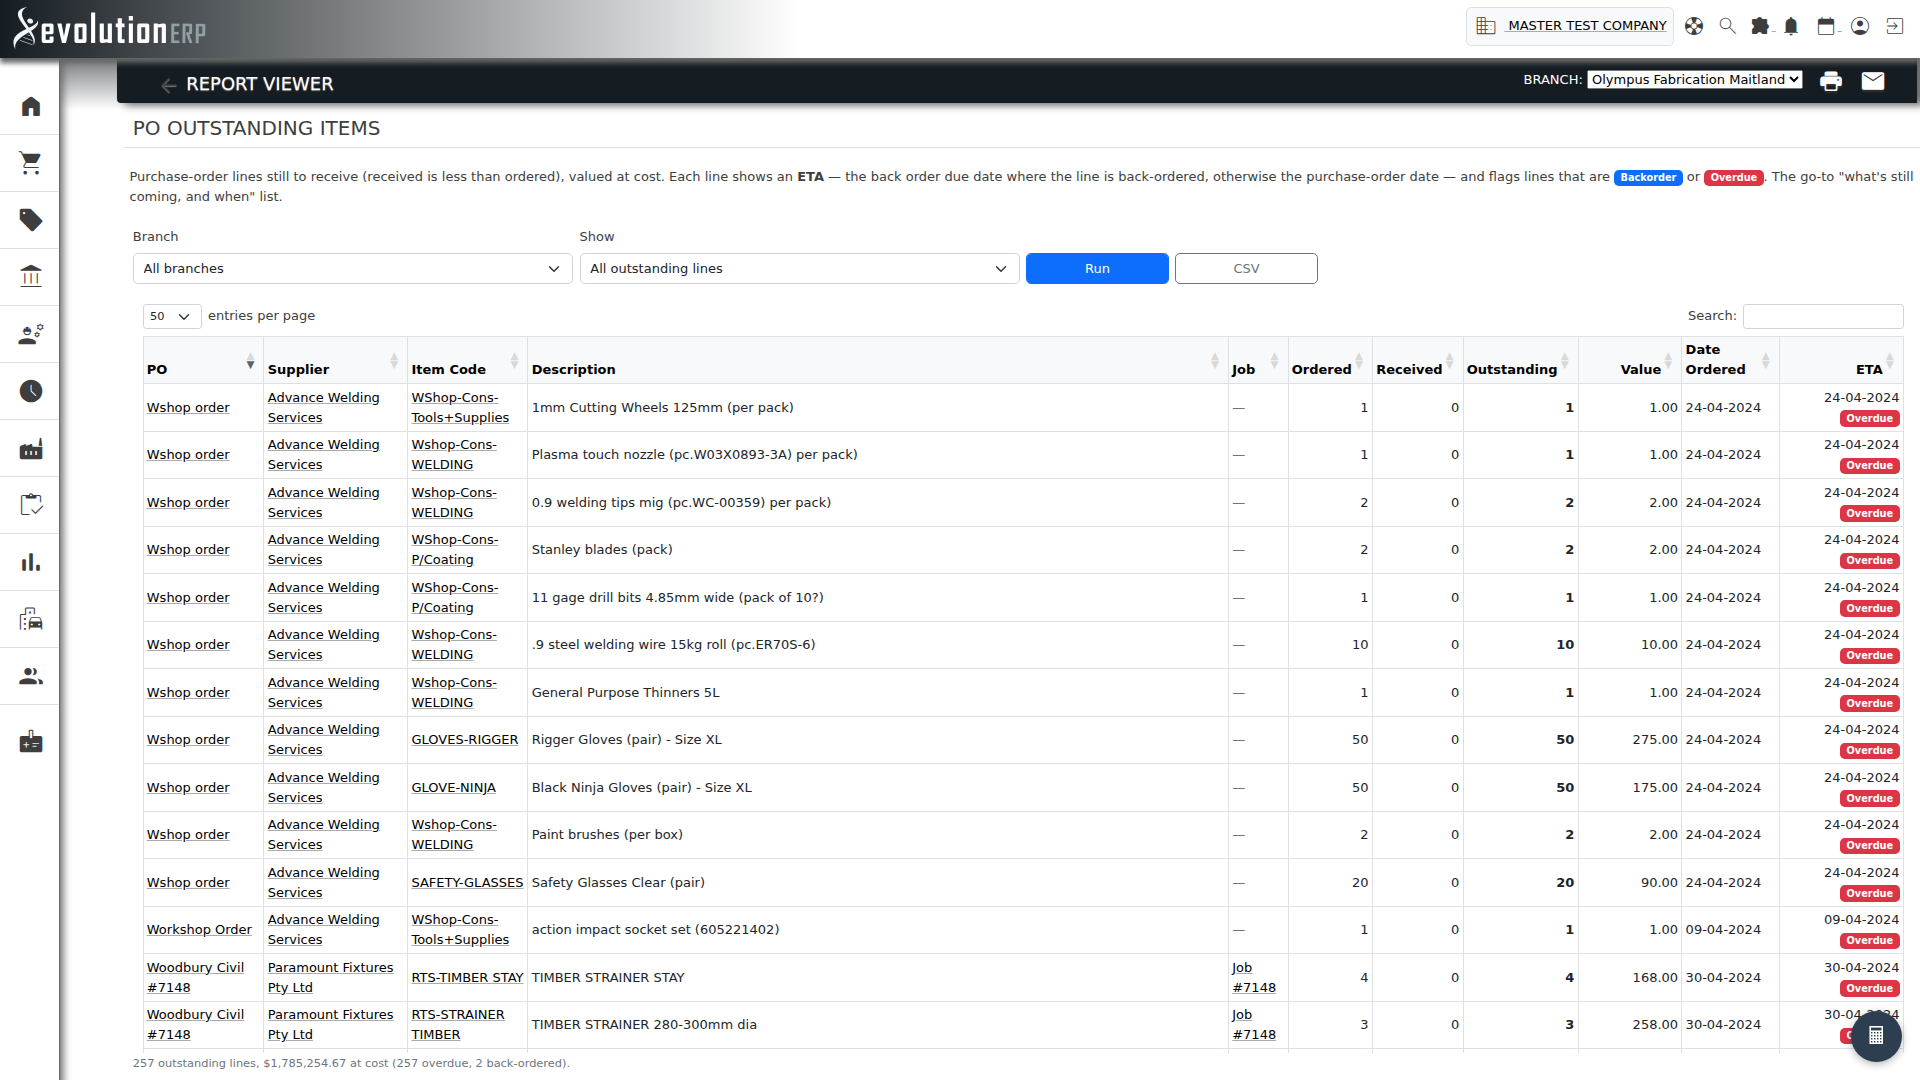
PO Outstanding Items Report
What it shows: Purchase-order lines still to receive (received is less than ordered), valued at cost, each with an ETA (the back order due date where the line is back-ordered, otherwise the PO date) and Backorder / Overdue flags.
How to use it: Filter by branch and by status (all / overdue only / back-ordered only) to chase late deliveries and spot items to reorder or source elsewhere. Export to CSV. (Formerly the "Purchase Backorder Report".)
Open PO Commitments
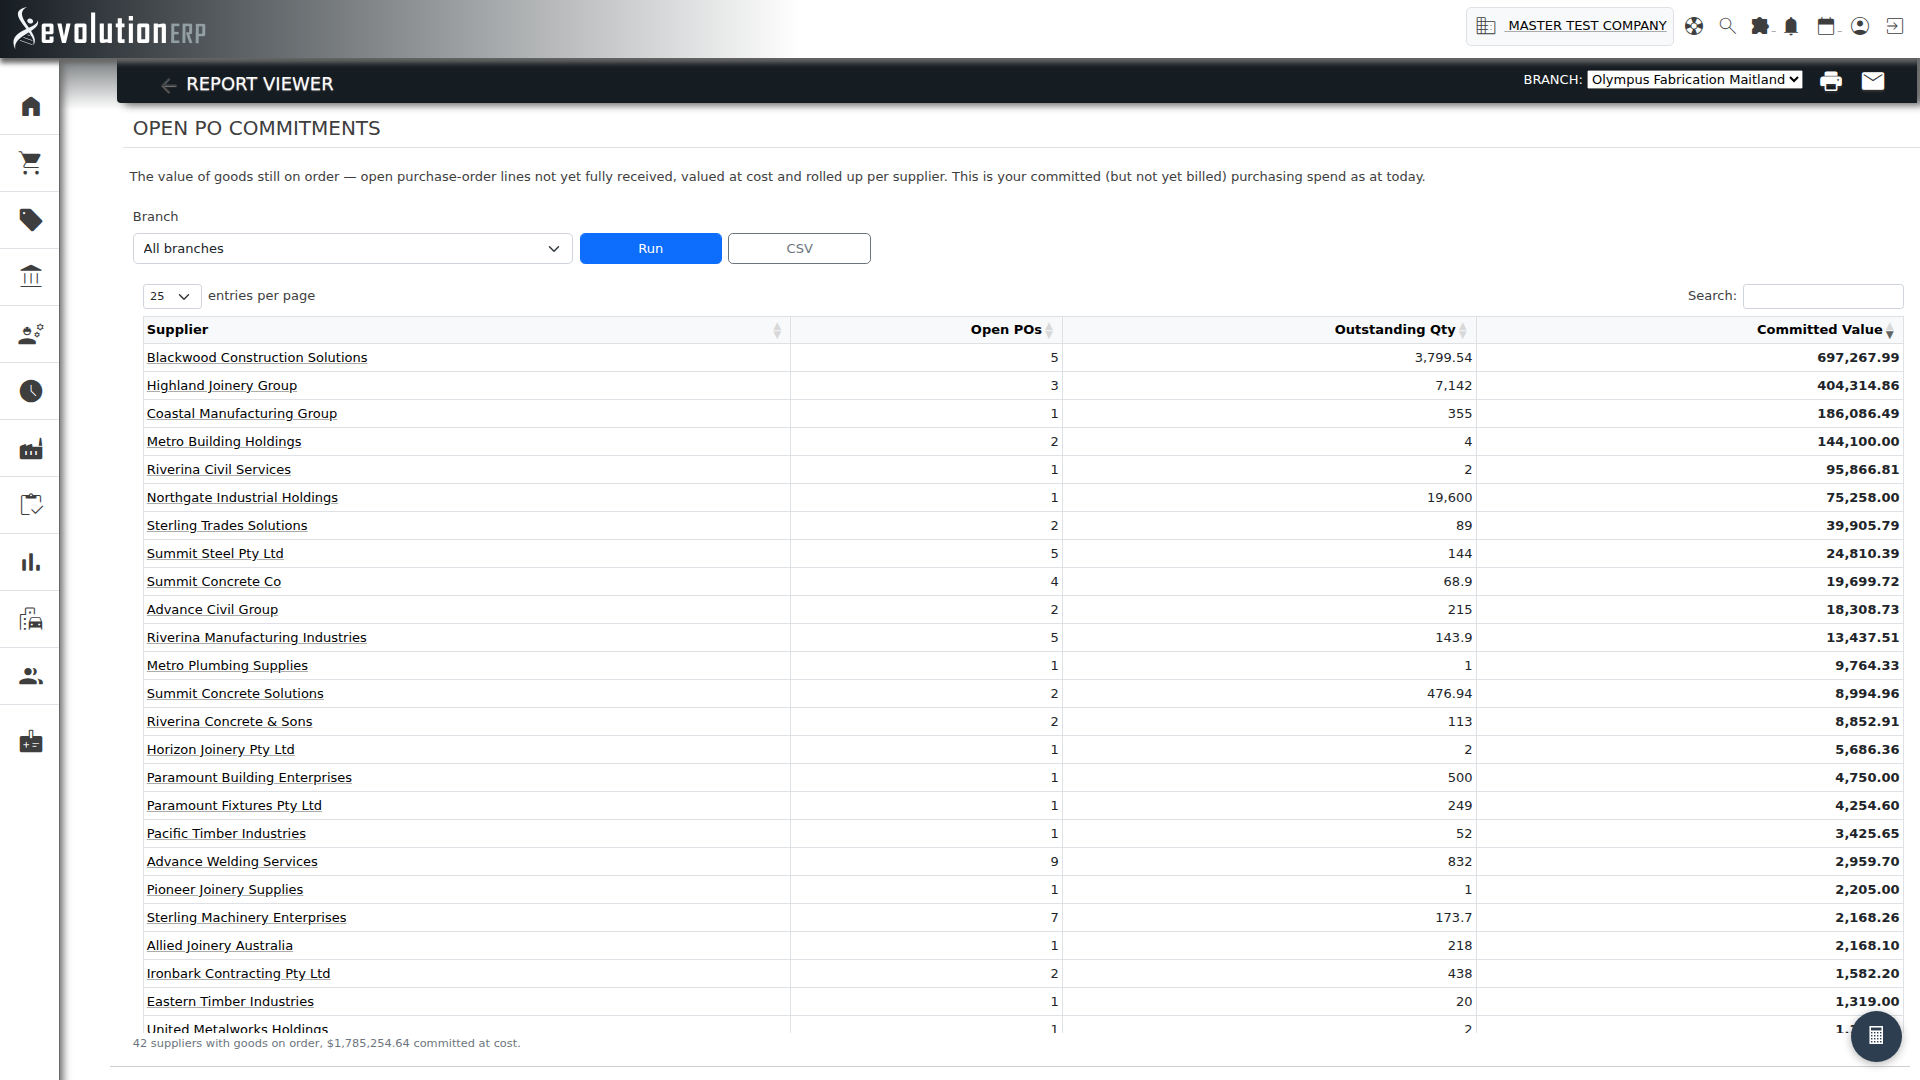
What it shows: The value of goods still on order — open purchase-order lines not yet fully received, valued at line cost and rolled up per supplier, along with the number of open POs and the outstanding quantity. This is your committed (but not yet billed) purchasing spend as at today.
How to use it: Filter by Branch and Run. Use it for cash-flow forecasting (what's coming that you'll be billed for) and to see which suppliers hold the most of your open commitment.
Purchasing by Project
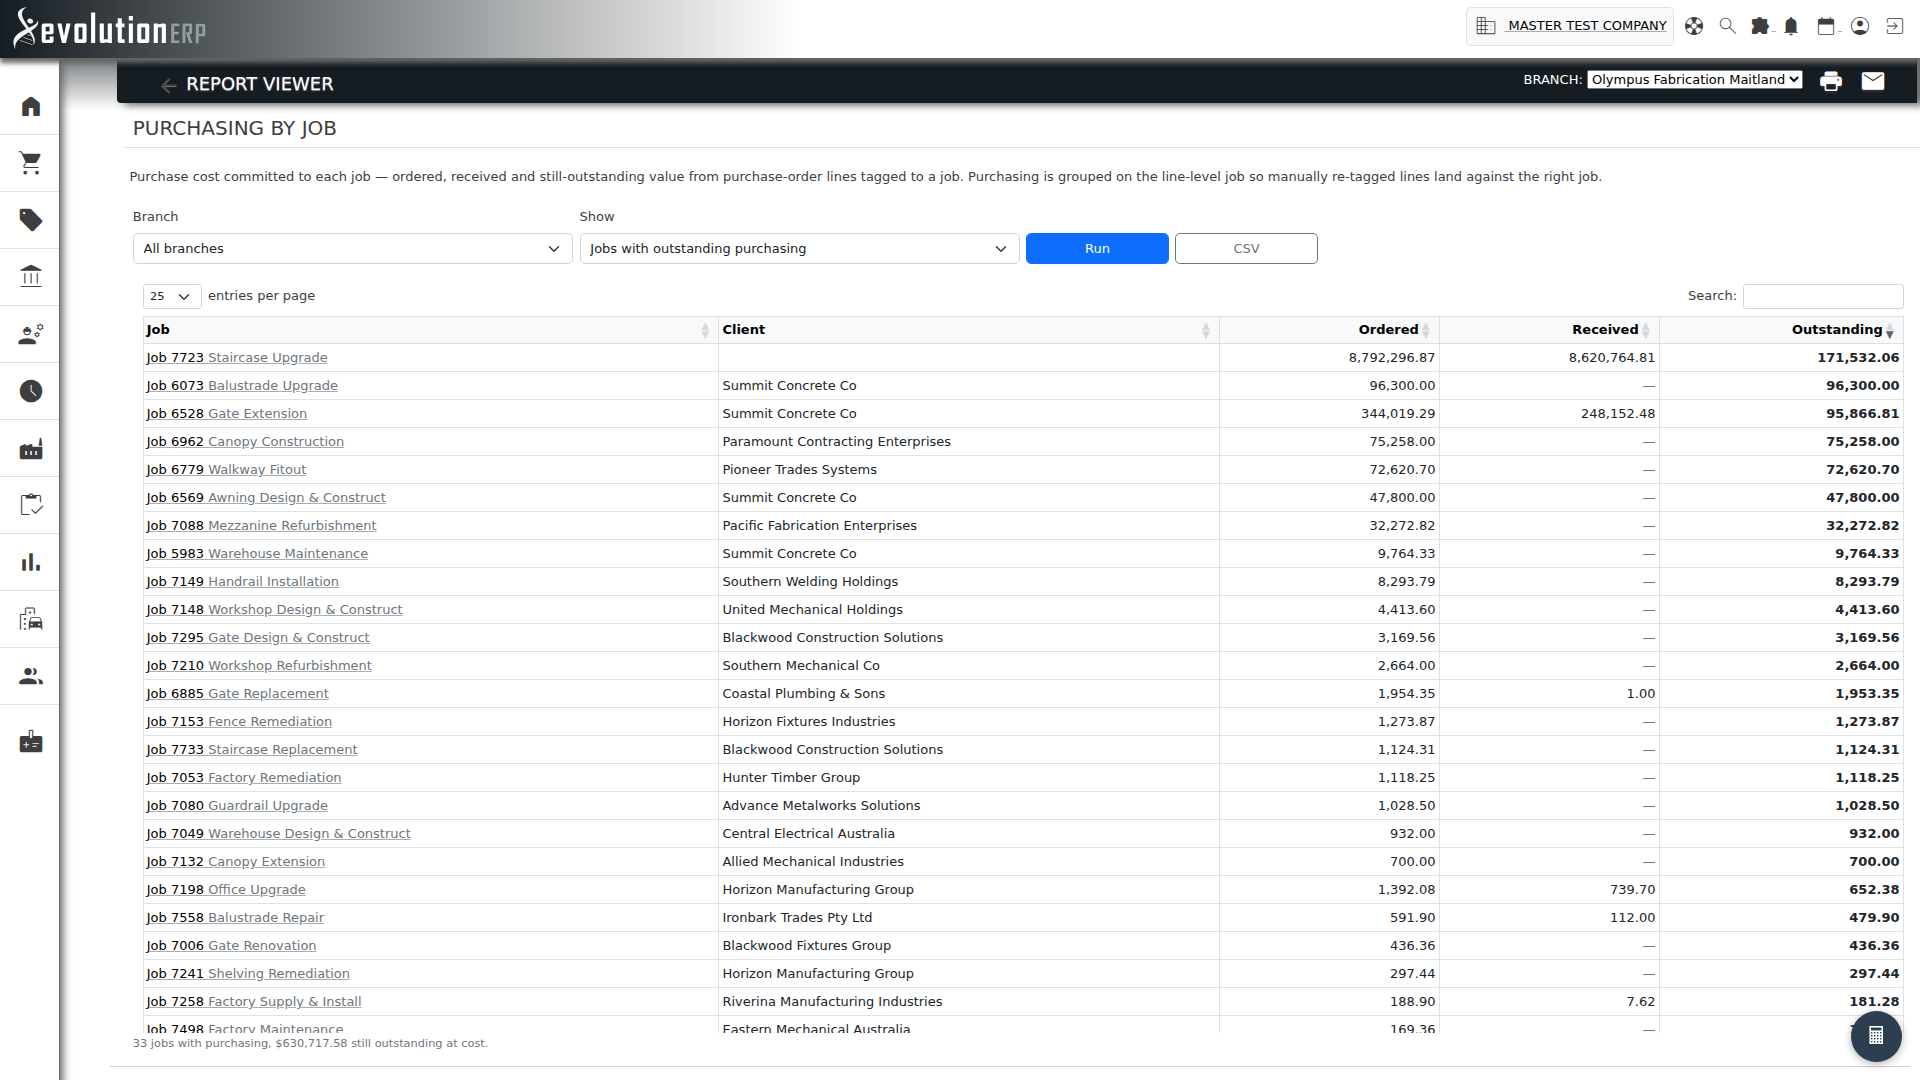
What it shows: Purchase cost committed to each project — Ordered, Received and still-Outstanding value from purchase-order lines tagged to that project. Purchasing is grouped on the line-level project, so lines re-tagged to a different project land against the right one.
How to use it: Filter by Branch and choose whether to Show only projects with outstanding purchasing or all projects with purchasing, then Run. Use it to track committed material cost against a project and to see what's still to land. Each project links to its record; it pairs with Job Costing for the full cost picture.
info This report covers active (open) purchase orders only. A purchase order is marked complete once all of its lines are fully received, at which point it drops out of this report — so the Ordered and Received figures reflect purchasing still in flight, not a project's entire purchasing history. For landed cost against a project, use Job Costing.
Suppliers
Supplier Spend
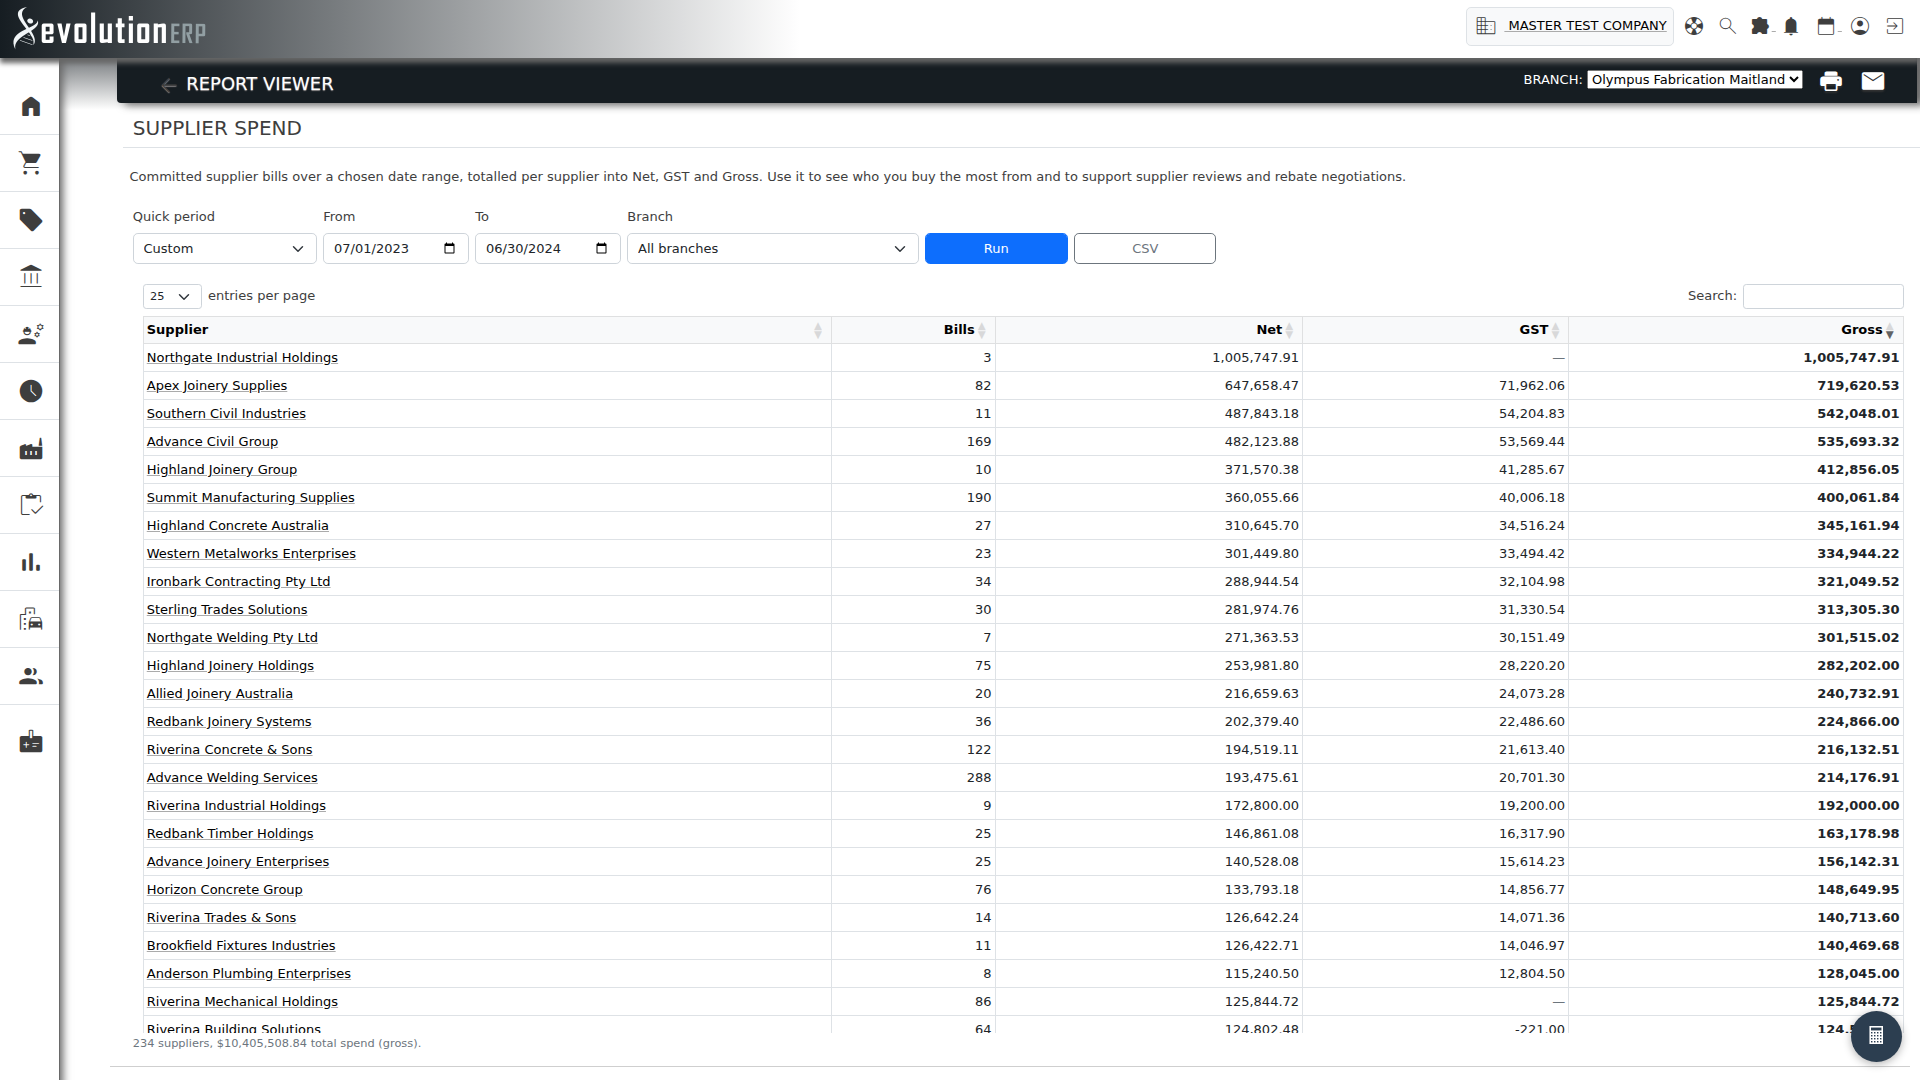
What it shows: Your committed supplier bills over a chosen date range, totalled per supplier into Net, GST and Gross, with a bill count — highest spend first. Only committed bills count; both draft and pending bills are excluded. Bills are counted by their entry date.
How to use it: Pick a Quick period — this month, last month, financial year to date (the default), last financial year, calendar year to date or last 12 months — or set the From / To dates by hand, and optionally a Branch, then Run. The financial-year presets follow your configured EOFY. Use it to see who you buy the most from ahead of supplier reviews and rebate negotiations. Each supplier links to its account record; the footer totals the whole range.
Purchase History
What it shows: What you have bought, from whom, when and at what price — the purchase history Evolution has always held but never surfaced in one place. Every purchase line over the chosen period, filterable by item and supplier, either line by line or rolled up with the price you paid first, last, lowest, highest and on average.
Where the figures come from — the Basis:
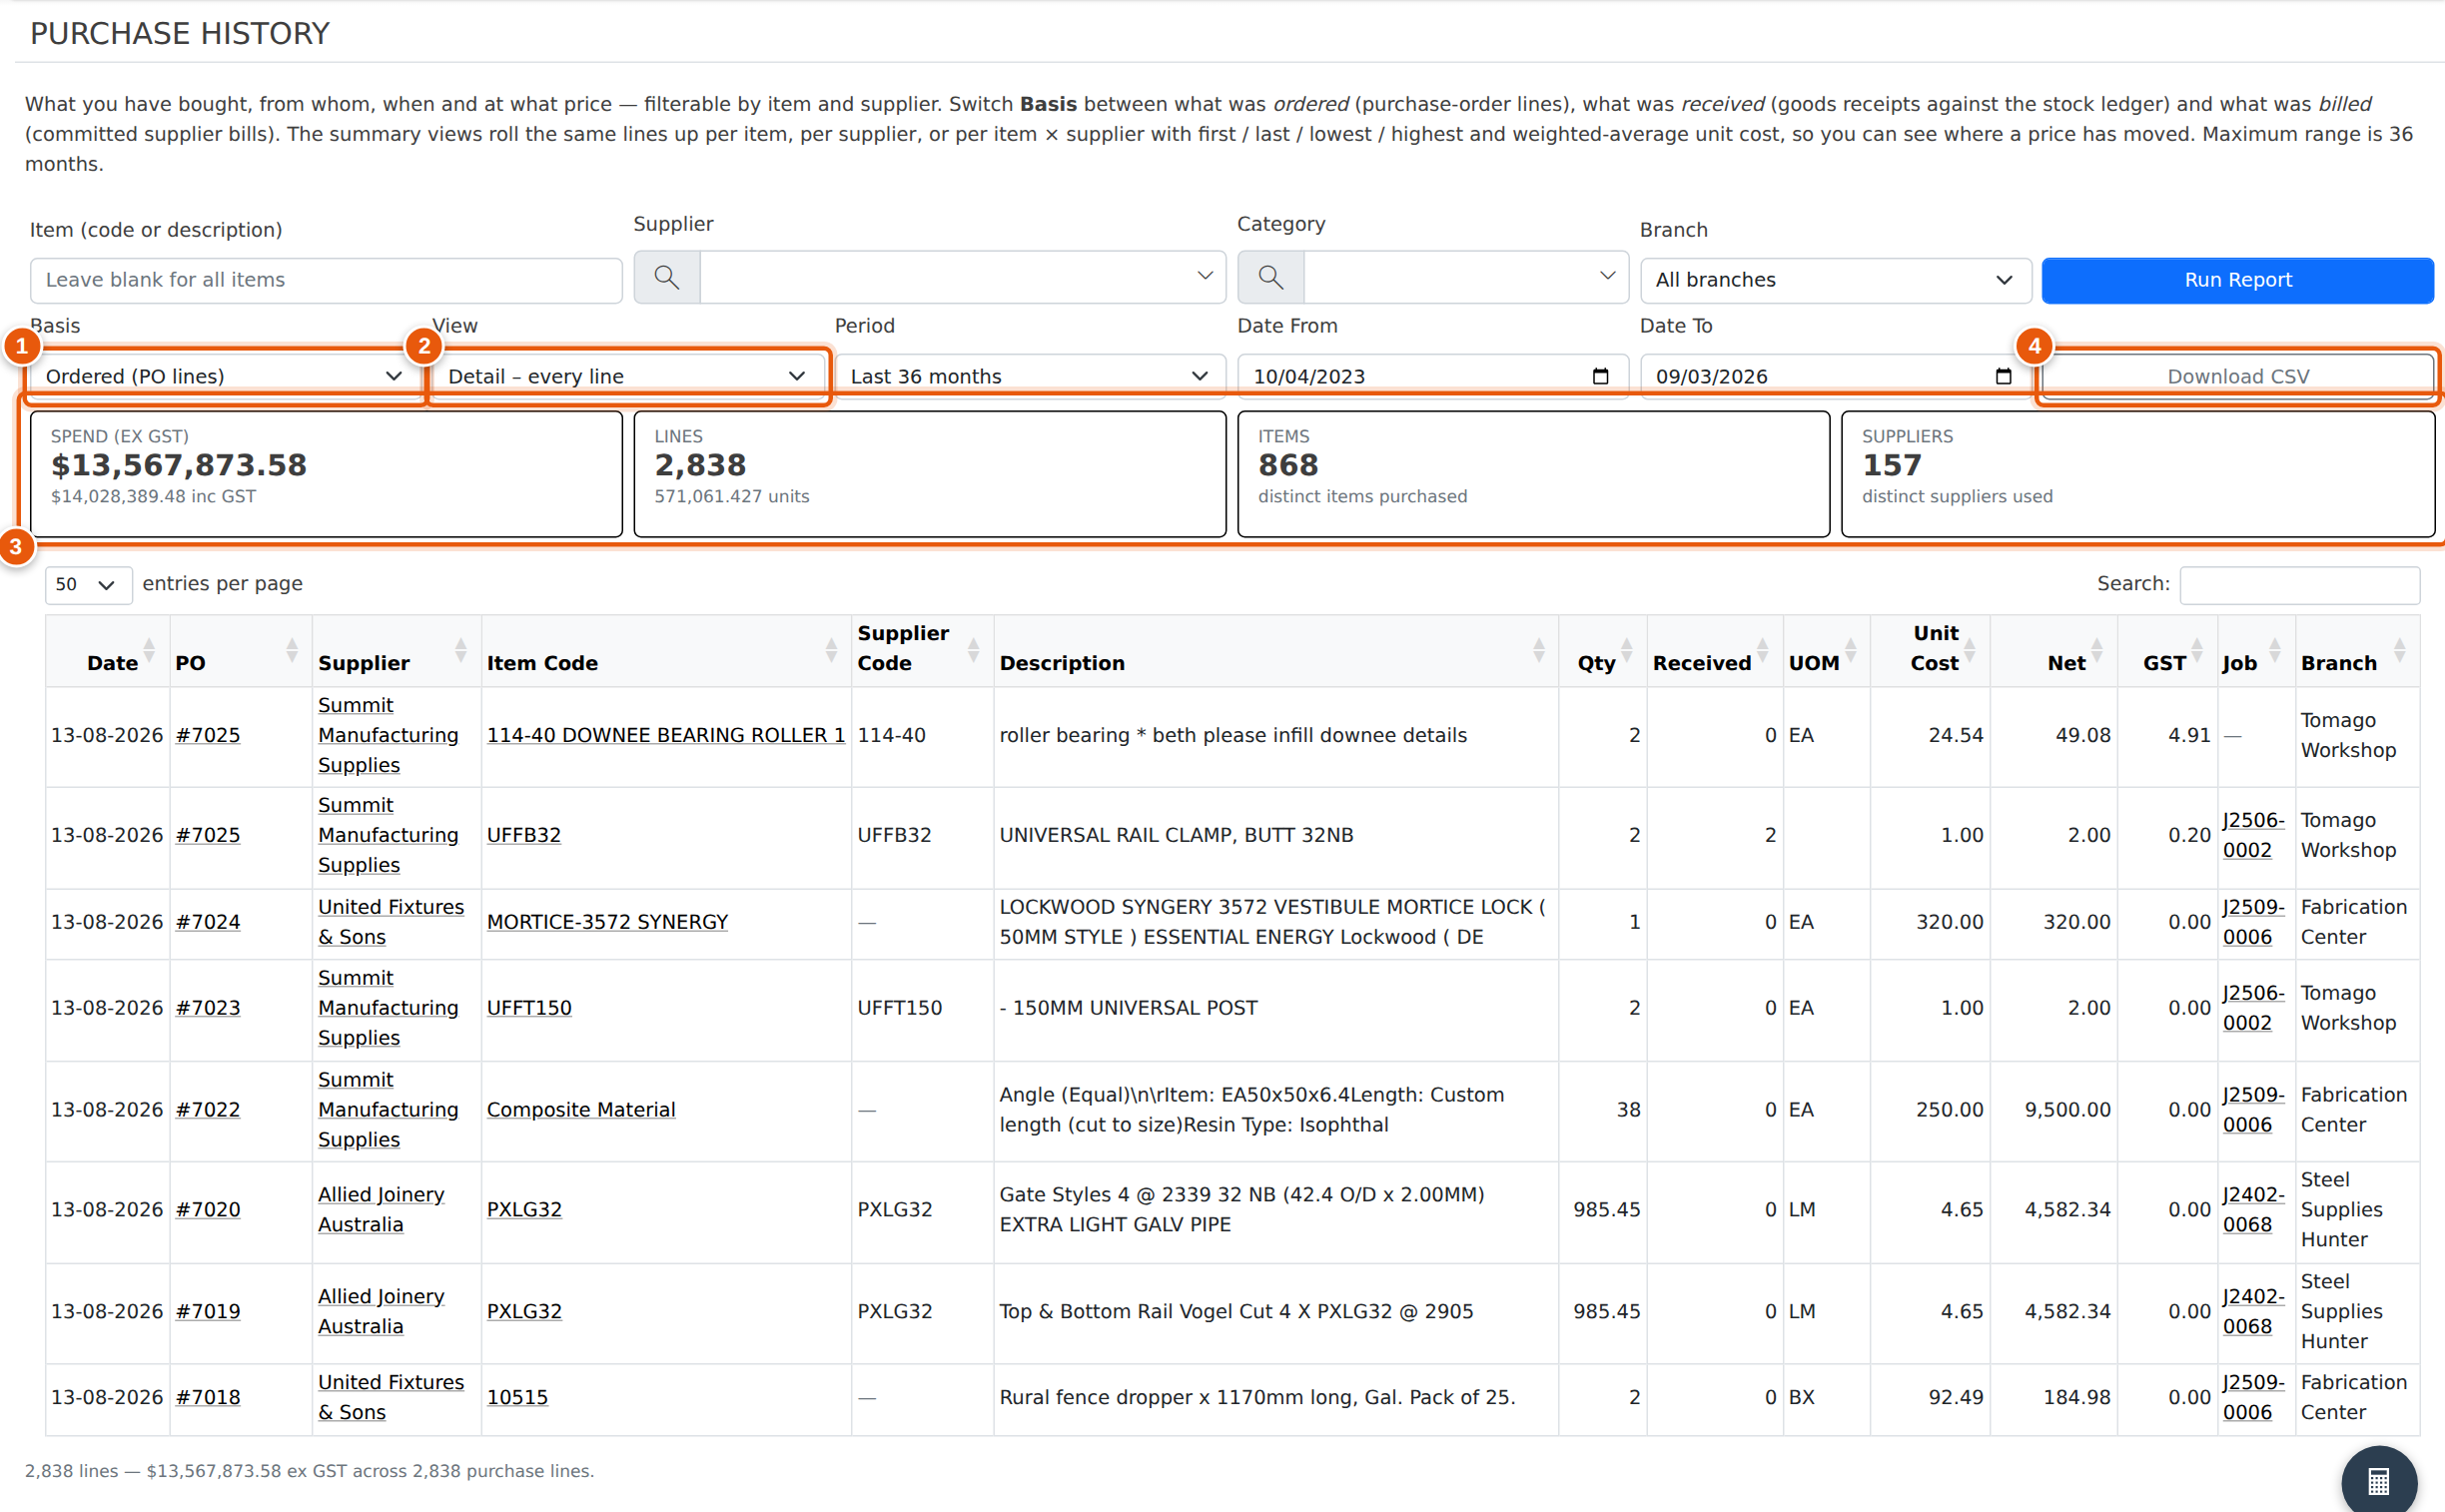
- Ordered (PO lines) – the default. Every line on a purchase order, dated by the purchase-order date and counted at the quantity ordered. This is the fullest picture and reaches back as far as your purchase orders go.
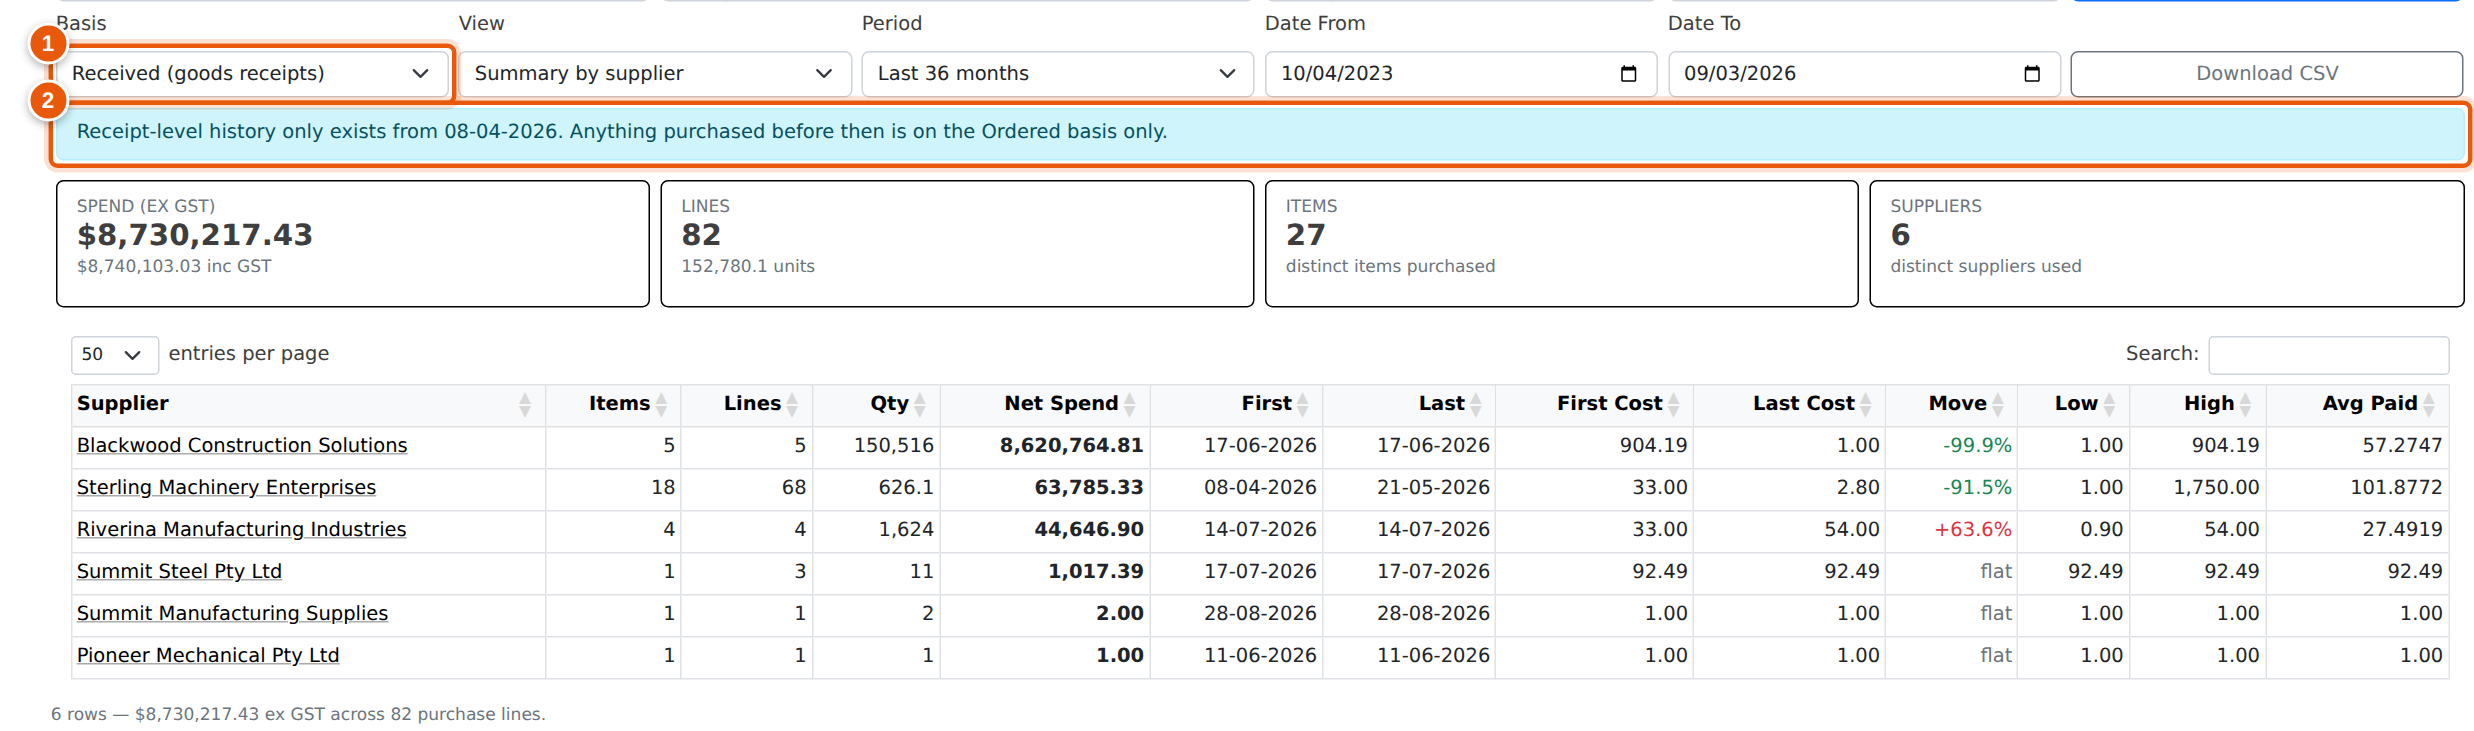
- Received (goods receipts) – only what actually arrived, dated by the day it was booked in and counted at the quantity received. Use this when you want physical receipts rather than intent. Receipt-level history only exists from the day your system began recording stock movements against purchase orders; if your date range starts earlier the report says so at the top.
- Billed (supplier bills) – the item lines on committed supplier bills, dated by the bill. This is what you were actually charged, so it is the basis to use when a supplier's invoice differs from the order.
The three bases answer different questions and will not tie to each other — an order raised in one month may be received in the next and billed in the one after.
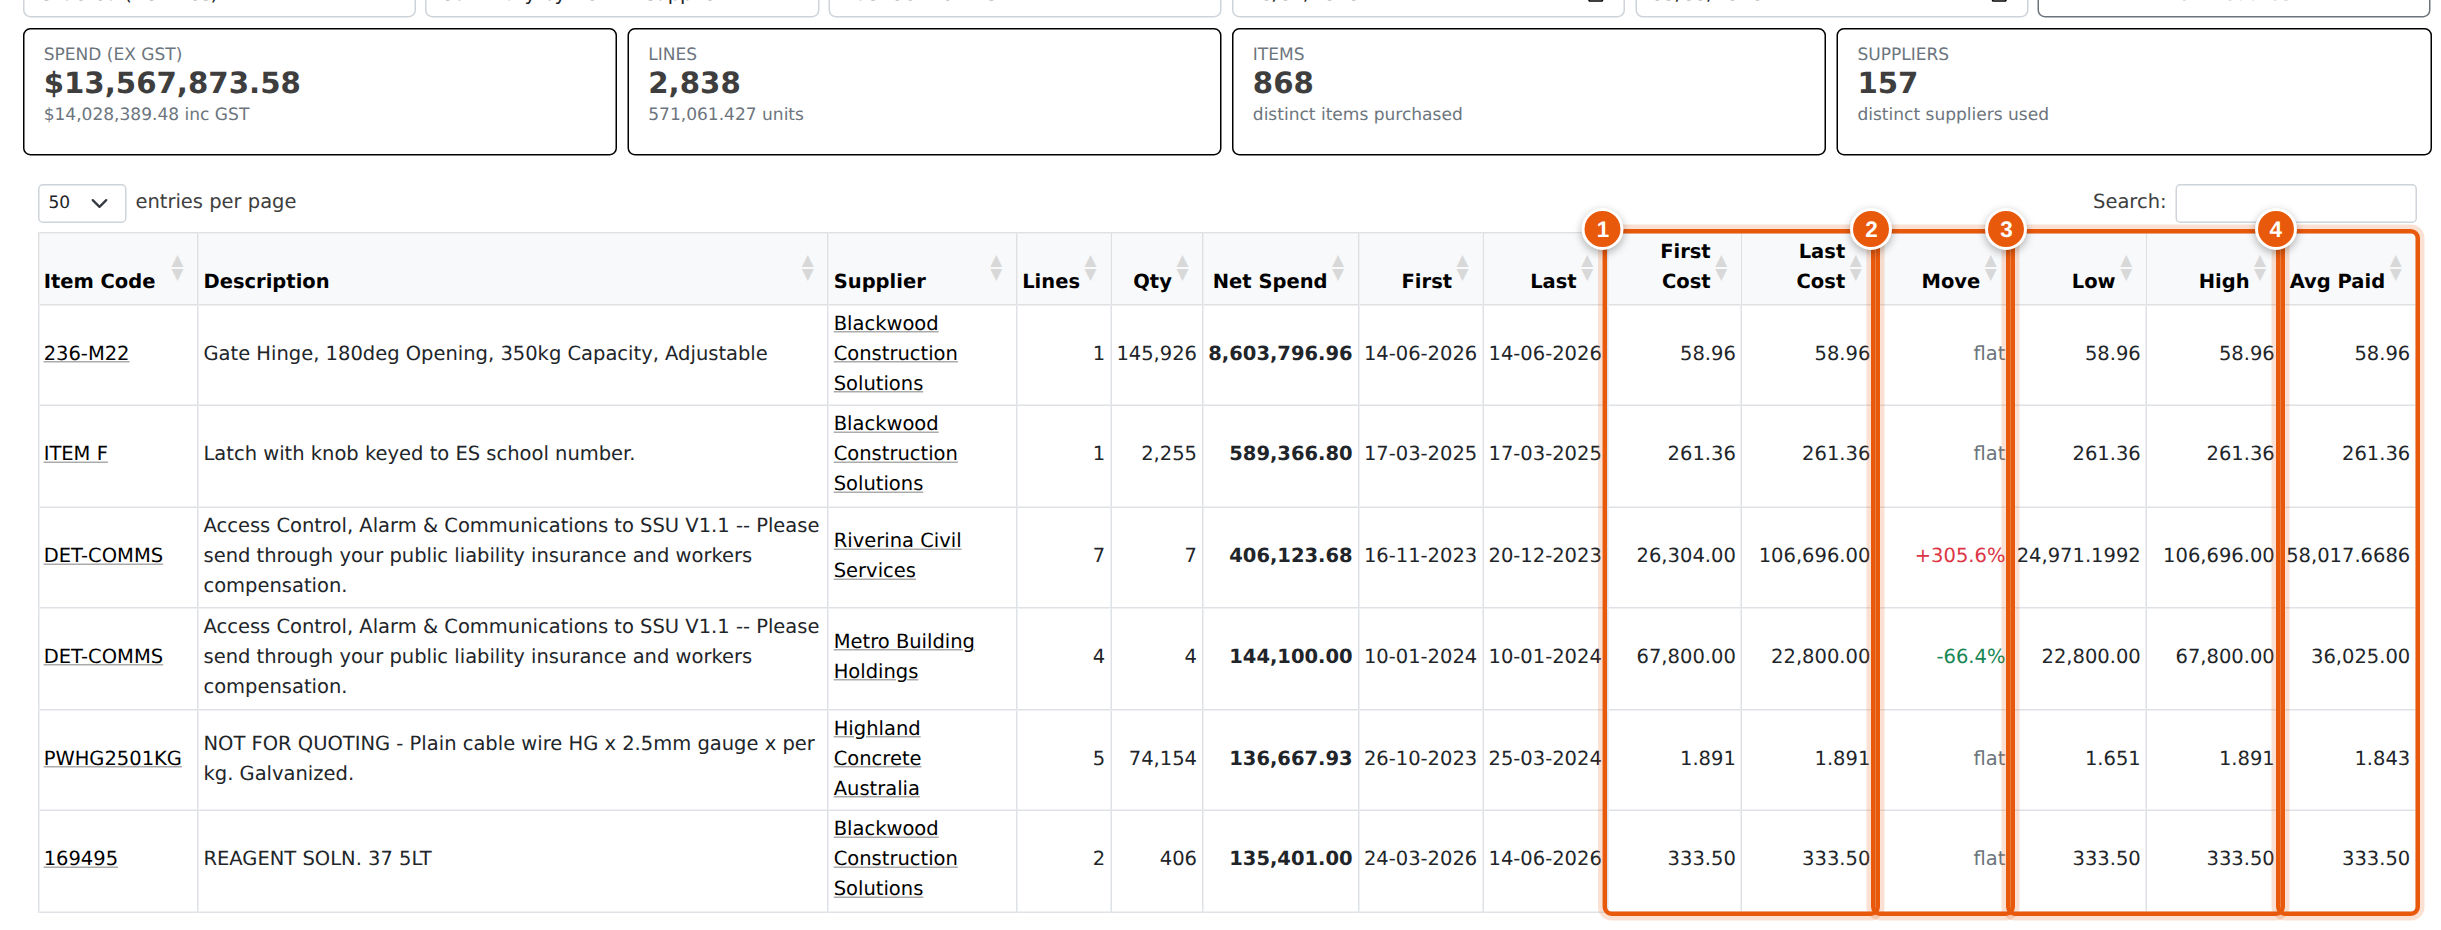
Views: Detail lists every line with its document, item, supplier part code, quantity, unit cost, net and GST, and links back to the purchase order or bill, the item, the supplier and the project. The three summary views roll the same lines up per item, per supplier, or per item × supplier, each showing the first and last price you paid, the Move between them (green when the price fell, red when it rose), the lowest and highest price, and the weighted-average price actually paid across the period.

- Item — part of an item code or description. Leave blank for everything.
- Supplier — one or many. Click the magnifier to search the list.
- Category — one or many inventory categories. Ticking a parent category includes its children.
- Branch — the branch the purchase was raised against.
- Basis — ordered, received or billed, as described above.
- View — every line, or one of the three summary roll-ups.
- Period — a preset, or your own From / To dates. Up to 36 months at a time.
- Run Report — nothing is fetched until you click it.
How to use it: Set a period — up to 36 months at a time — then narrow with any combination of item code or description, one or more suppliers, one or more inventory categories, and branch, and click Run Report. The four cards across the top total spend, lines, distinct items and distinct suppliers for everything matching your filters, whether or not every line fits on the page. Download CSV exports the current view.
Some worked examples: pick one item and switch to Summary by item × supplier to see what each supplier charges you for it; pick one supplier and sort by Move to find where their prices have crept up; leave the filters empty on Summary by item to find your biggest spend lines before a buying review.
A word on the Received basis. Receipt history only goes back as far as your stock movements do. When the period you have chosen starts before that, the report says so rather than quietly showing you a short answer — anything bought earlier is visible on the Ordered basis.
Related Reports
The PO Outstanding Items, Demand Deficit, Re-order Insights and Min / Max Re-order reports are also surfaced inside Purchase Tracking, where they sit alongside the day-to-day purchase-order workflow. What you owe suppliers is Purchase History covers what you have already bought; what is still on order is in PO Outstanding Items, and a single item's full stock story (purchases, sales, adjustments) is in Item History. What you owe suppliers is aged in the Aged Payables (Creditors) report under Financials.