Where to Find Them
Menu → Reports → Reports Dashboard, then the Inventory pill.
Inventory reports are available to staff with inventory or reporting access; the Item History / Stock Card requires inventory access specifically. Each report runs in the browser — set the filters, click Run, sort or search the table, and export the current view with Download CSV. Large result sets are capped (each report notes its limit); add filters to bring the rest into view.
General Reports
Inventory List
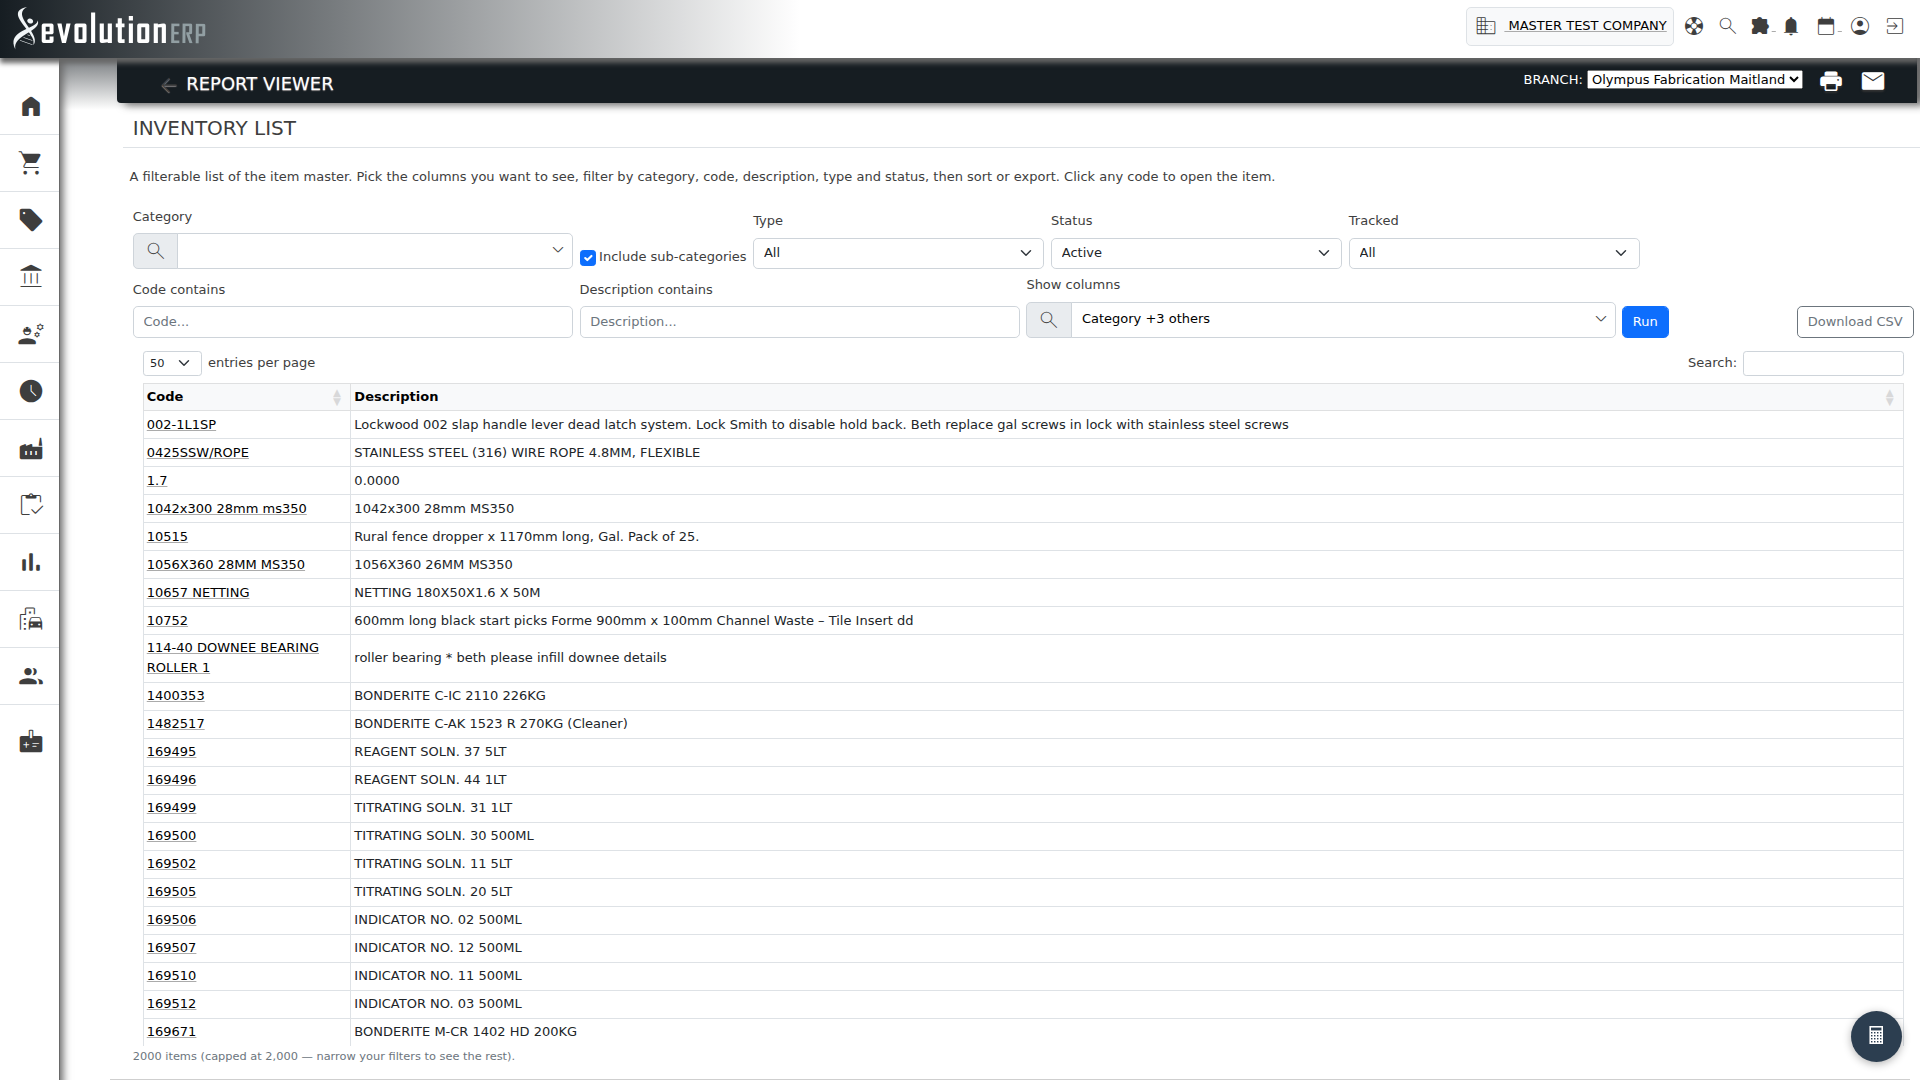
What it shows: A filterable list of the item master. Code and description always show; you choose which extra columns to add — category, type, cost/price fields, SOH, allocated/on-order, supplier, GL accounts and more.
How to use it: Pick the columns you want under Show columns, then narrow the list by category (tick Include sub-categories to pull in every descendant), code, description, type (Product / Service), status and tracked flag. Click any code to open the item, sort any column, or Download CSV. Large catalogues are capped at 2,000 rows — add filters to see the rest. Replaces the old Inventory List Report – Customizable.
Stock on Hand
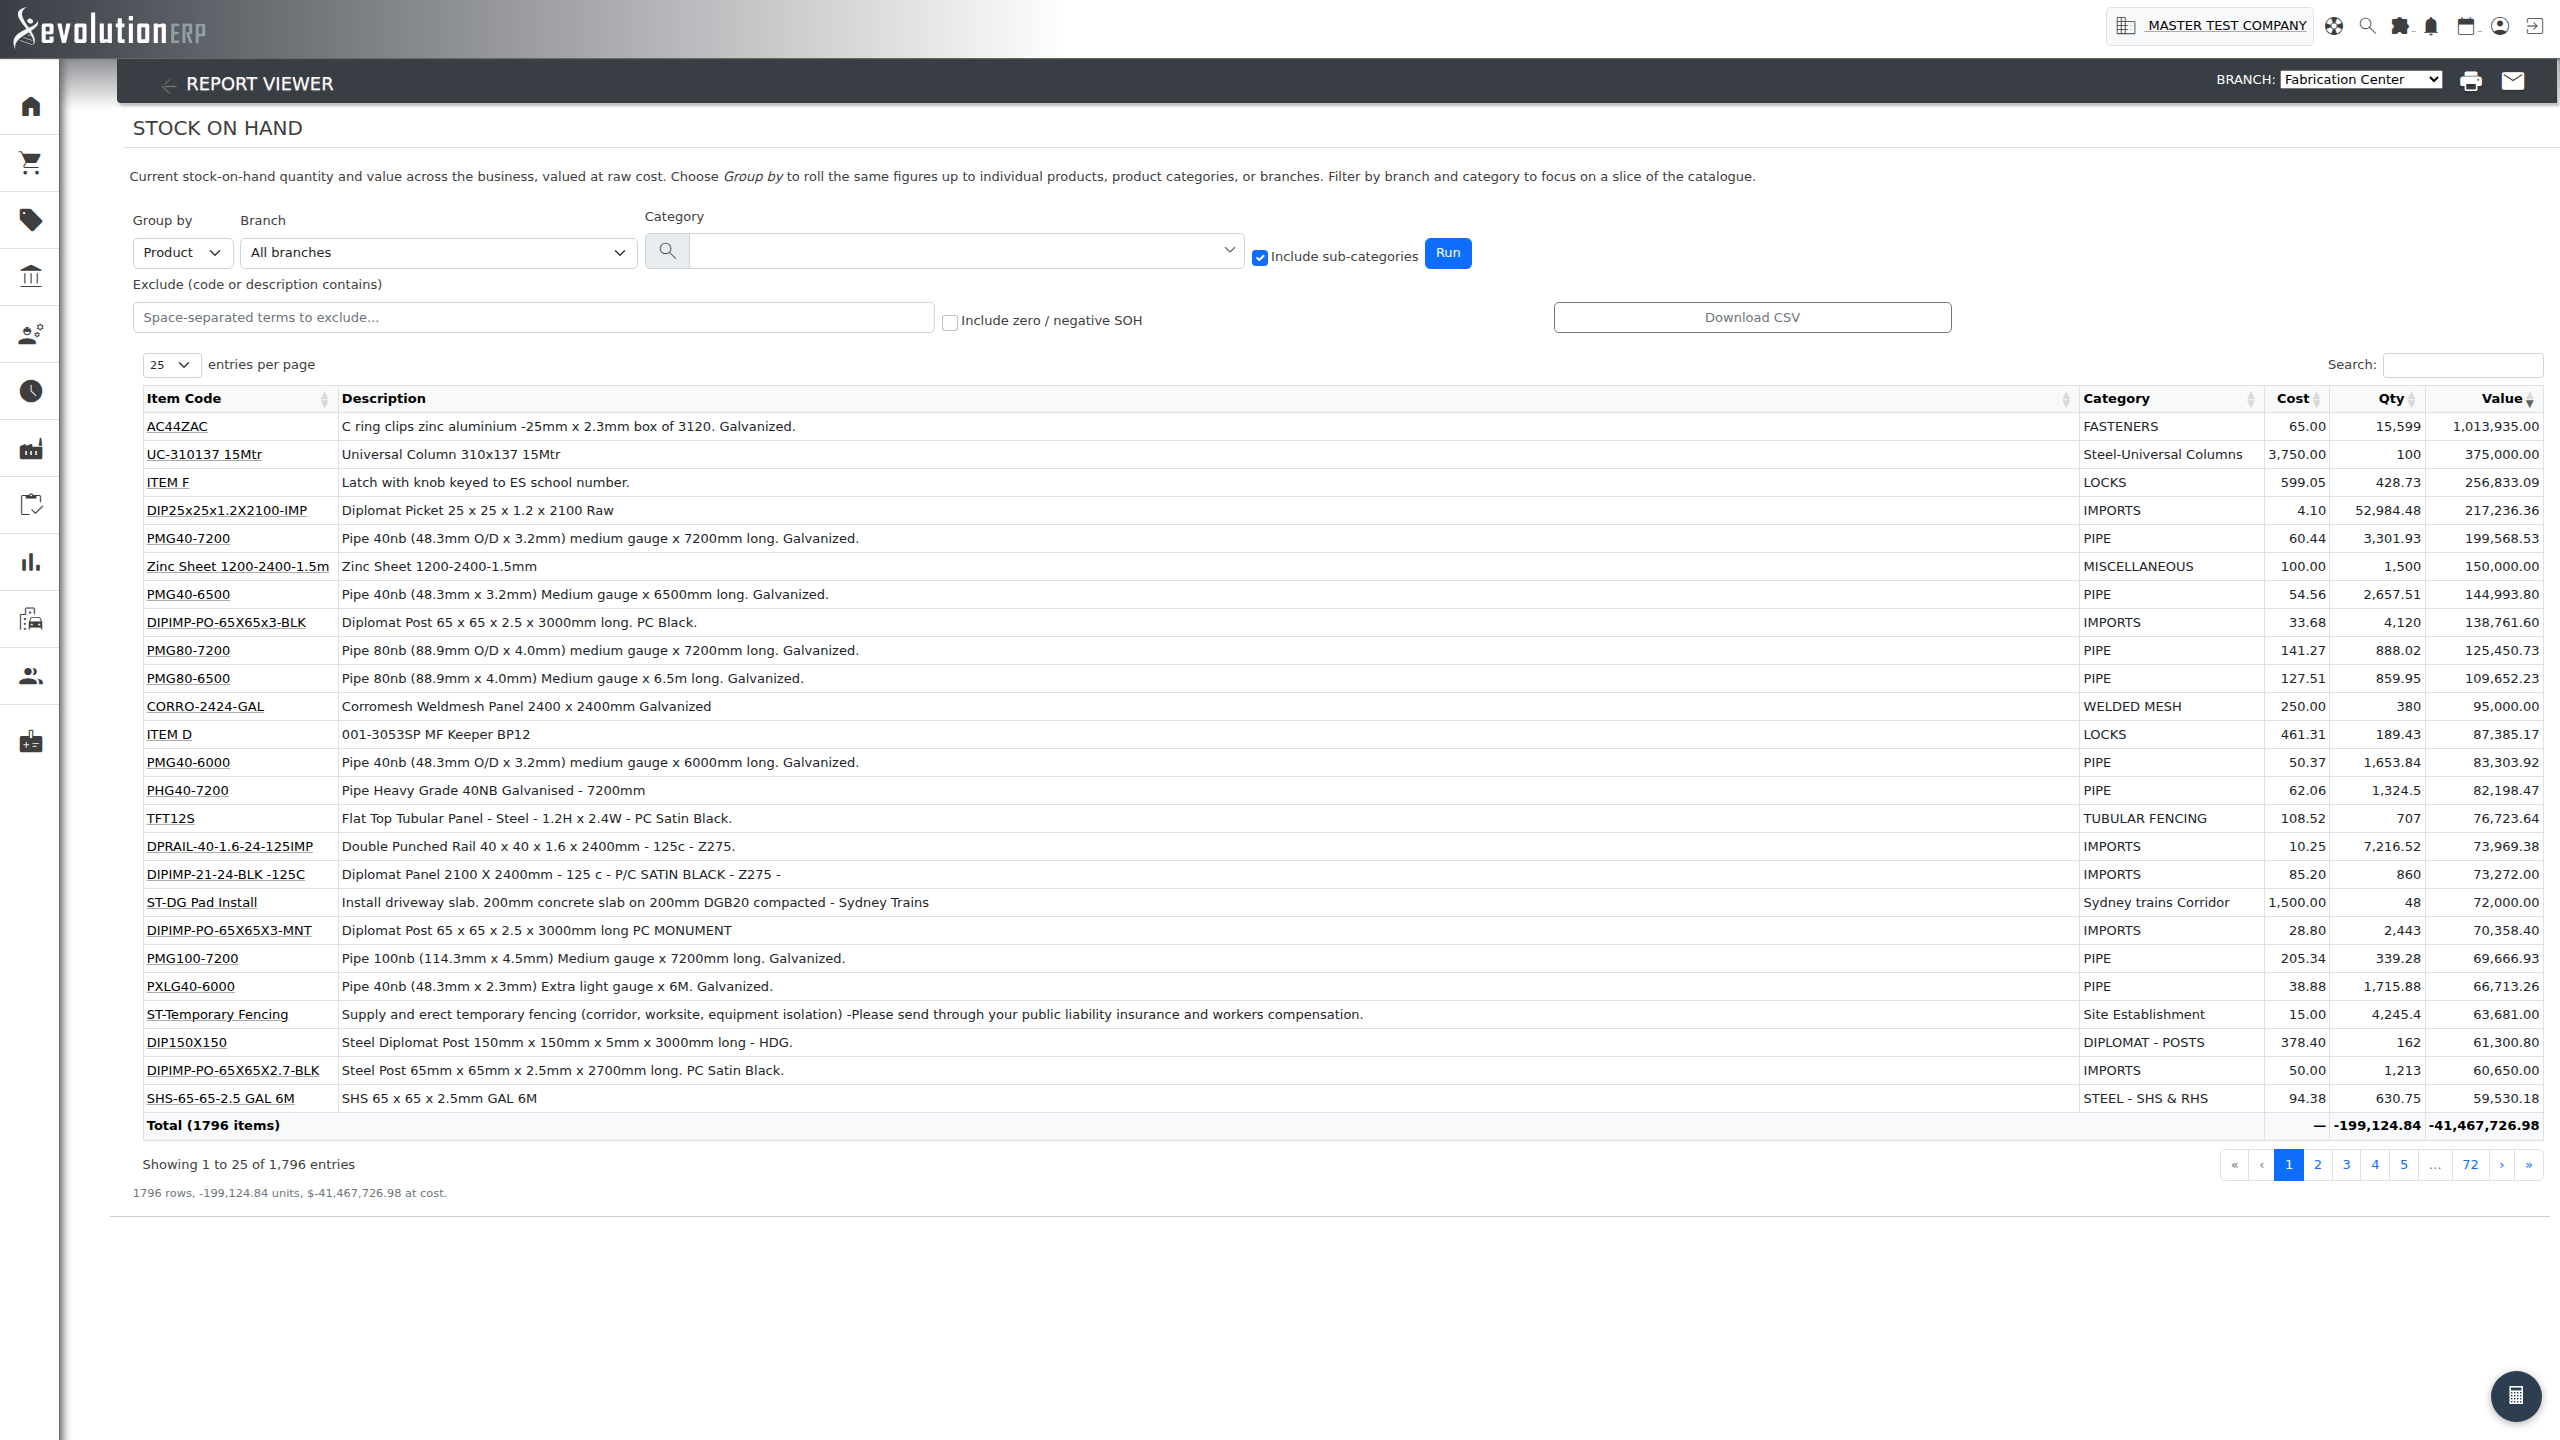
What it shows: Current stock-on-hand quantity and value across the business, valued at raw cost. A single report that replaces the previous separate SOH by Branch, SOH by Product Category and SOH by Product reports.
How to use it: Set Group by to roll the same figures up to Product (one row per item), Category, or Branch. Filter by branch and one or more categories (tick Include sub-categories to pull in every descendant category), and use the Exclude box to drop items whose code or description contains any of the terms you list. Only items with a non-zero balance are shown by default — tick Include zero / negative SOH to see the rest. In Product view, click an item code to open the item. Sort any column, and use Download CSV for the current view. The Product view is capped at 10,000 rows; narrow by category or the exclude filter if you hit it.
Manufacturing
Raw Material (BOM) Restocking Report
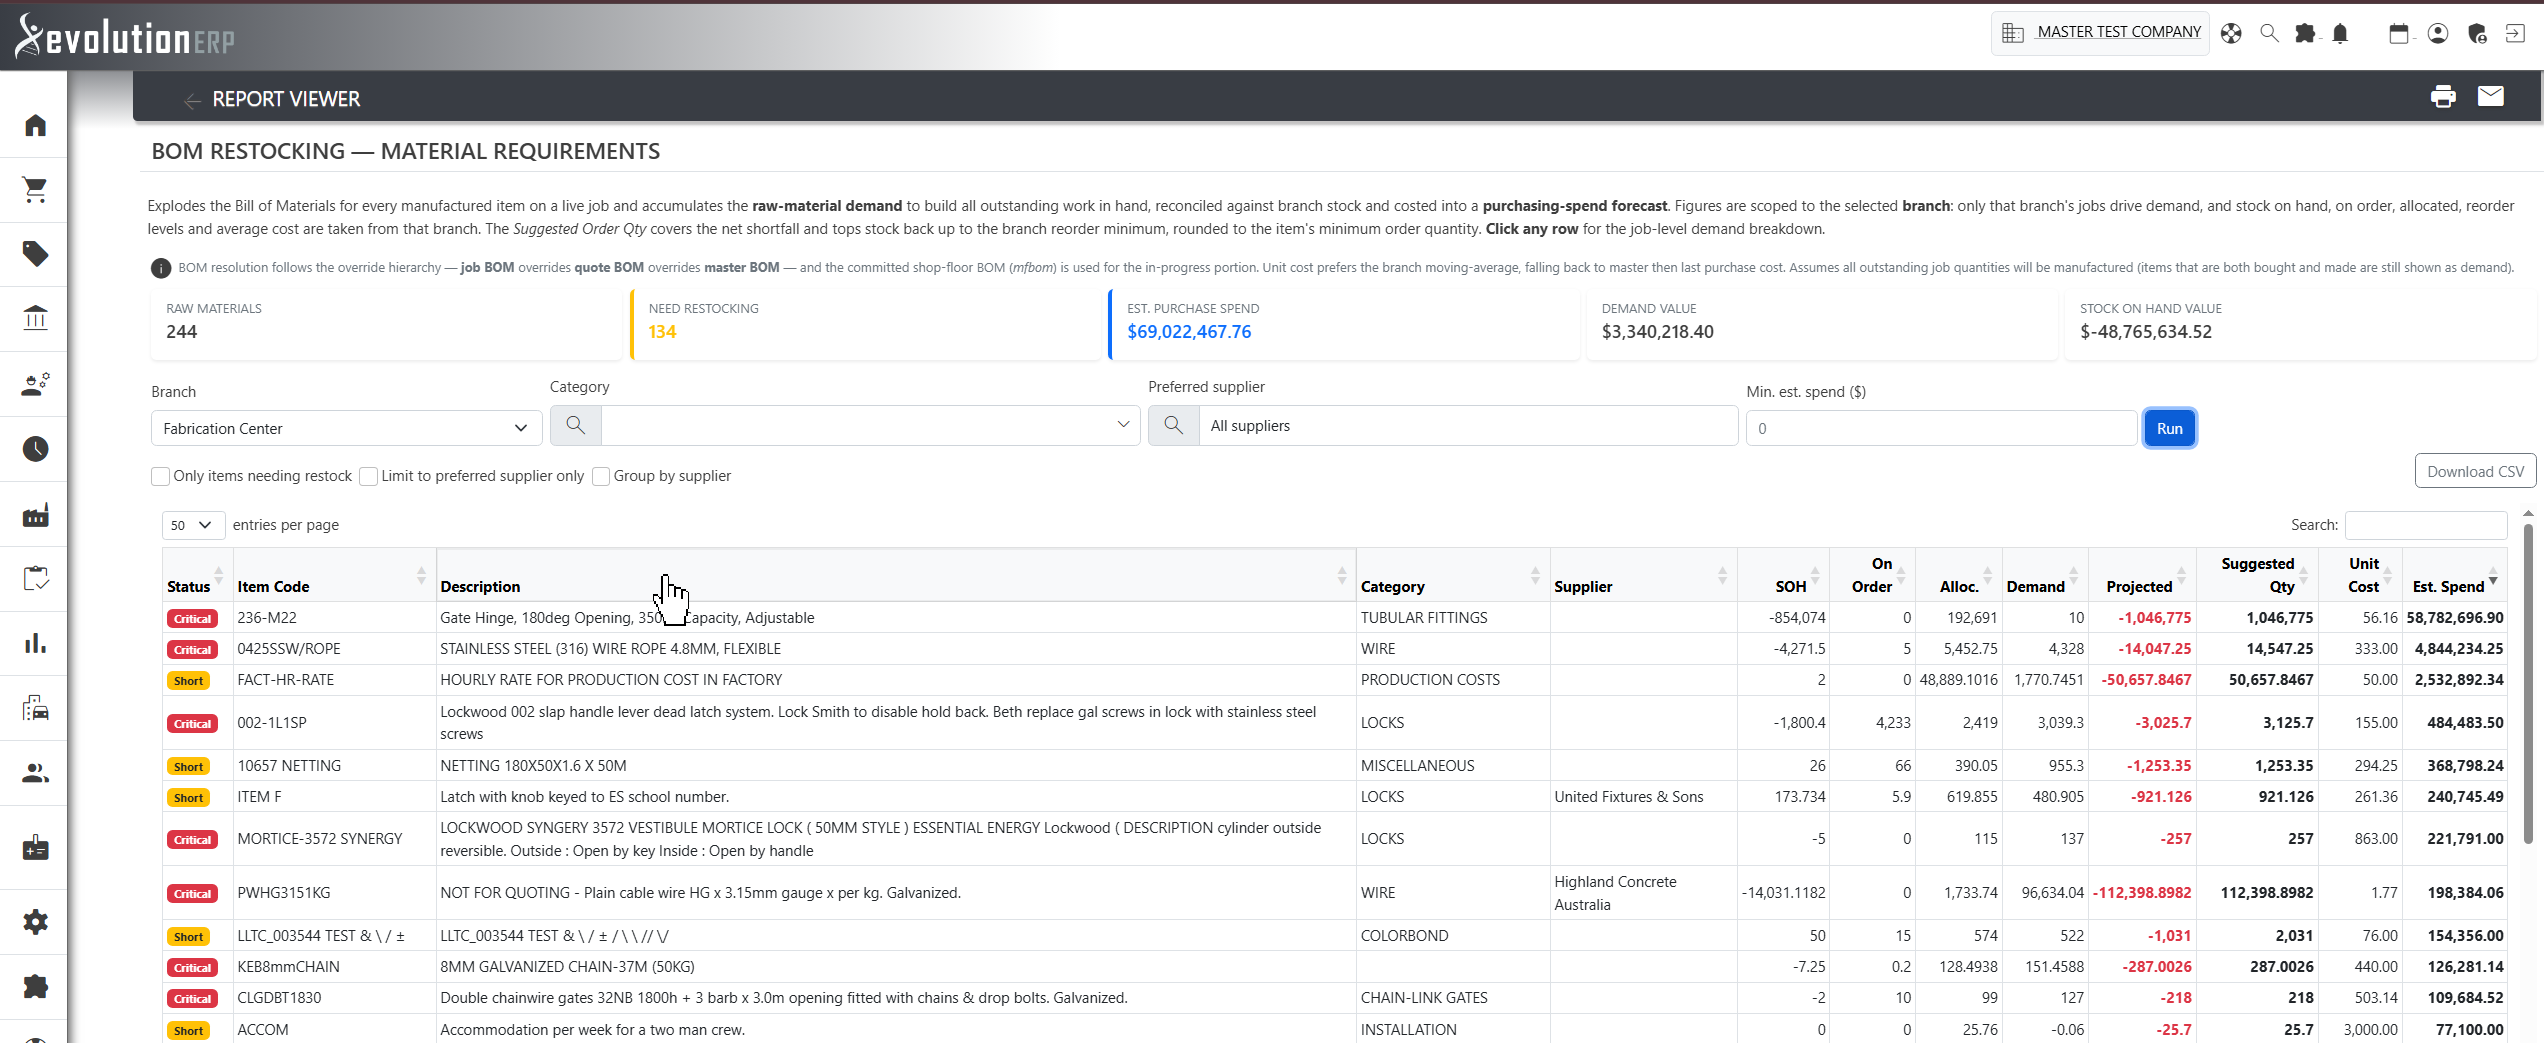
What it shows: Raw-material (component) requirements for a branch, exploded from the bills of material of the finished goods on active projects, netted against branch stock and costed into a purchasing-spend forecast. For each component it shows stock on hand, on order, allocated, a projected balance (what stock will be left once the outstanding demand is consumed) and a Suggested Order Qty that covers the shortfall and tops stock back up to the branch reorder minimum, rounded to the item's minimum order quantity. Each line carries a unit cost and an estimated purchase spend, and a status badge (OK / Order / Short / Critical) for at-a-glance triage. KPI tiles across the top total the items needing restock, the estimated purchase spend, the demand value and the stock-on-hand value. Click a component to expand a per-job demand breakdown (with customer and dollar value).
How to use it:
- Choose the branch and optionally narrow by category or supplier (start typing to search), then click Run. By default the supplier filter shows every item that supplier can supply — both items where they are the preferred supplier and items they stock under their supplier codes. Tick Limit to preferred supplier only to restrict the list to items whose preferred supplier is the one selected.
- Tick Only items needing restock to hide anything already covered by stock, or set a minimum estimated spend to focus on the material lines that matter to the budget.
- Tick Group by supplier to cluster items under their preferred supplier with an estimated-spend subtotal — ready to raise one purchase order per supplier.
- Use Download CSV for an analysis-ready export of every column, and use the report ahead of a production run to raise the right raw-material purchasing.
info BOM explosion follows Evolution's override hierarchy — a job-level BOM overrides a quote-level BOM, which overrides the item's master BOM — and includes manufacturing (mfbom) components, so the requirements reflect what each project will actually consume rather than a generic parts list. Unit cost prefers the branch moving-average, falling back to the master cost then the last purchase cost.
Bill of Material Detail Report
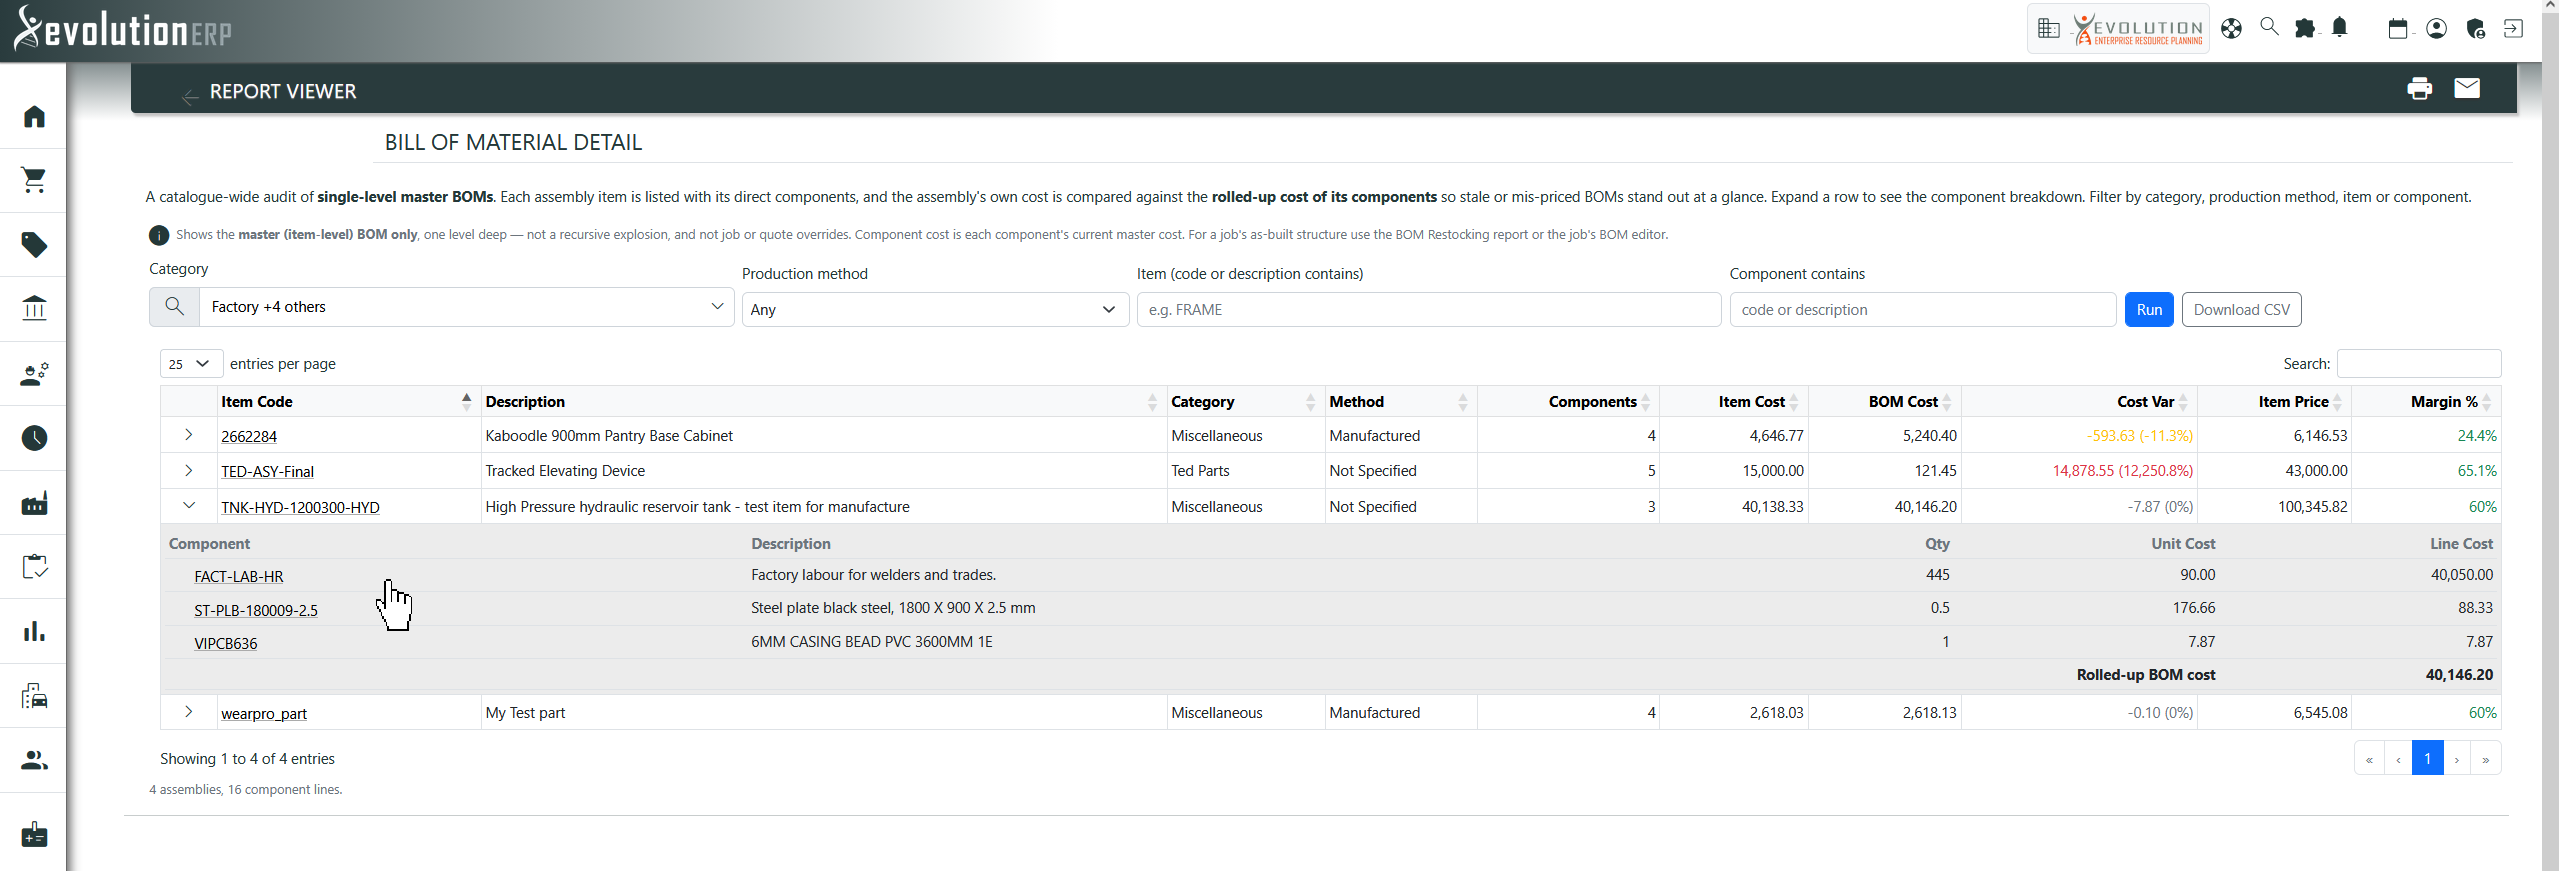
What it shows: A catalogue-wide audit of assembly items and their single-level master BOM components. Each assembly is listed with its own cost and price, the rolled-up cost of its components (the sum of each component's quantity × current master cost), and the variance between the two — so an assembly whose stored cost has drifted from what its components now cost stands out immediately. Expand any row to see the full component breakdown. It is a bulk view across many items at once (not a deep recursive explosion of one assembly), so it is the quickest way to sanity-check master BOM pricing across a whole category.
How to use it:
- Filter by category, production method, an item code/description, or a component code/description, then click Run. All filters are optional; the result is capped at 2,000 assemblies per run, so narrow down if you hit the cap.
- Scan the Cost Var column: a large positive or negative variance (shown amber, then red) means the assembly's own cost no longer matches the current cost of its components — a candidate for re-costing.
- Check Margin % (the assembly's own price against its own cost) to spot thin or negative margins.
- Expand a row to review each component's quantity, unit cost and line cost, and use Download CSV for an analysis-ready export (one row per component with the parent figures repeated).
info This report shows the master (item-level) BOM only, one level deep, and is read-only. Component cost is each component's current master cost. For a project's actual as-built structure — including project and quote overrides — use the BOM Restocking report or the project's own BOM editor.
Inventory Analytics
Three rebuilt analytics reports for understanding what sells, how a single item performs, and where stock physically moves. All three share a consistent filter bar, live search-and-sort tables, and one-click CSV export. Sales figures use committed invoices only and the same per-line revenue and gross-profit basis, so the numbers reconcile across reports.
Product Sales Performance
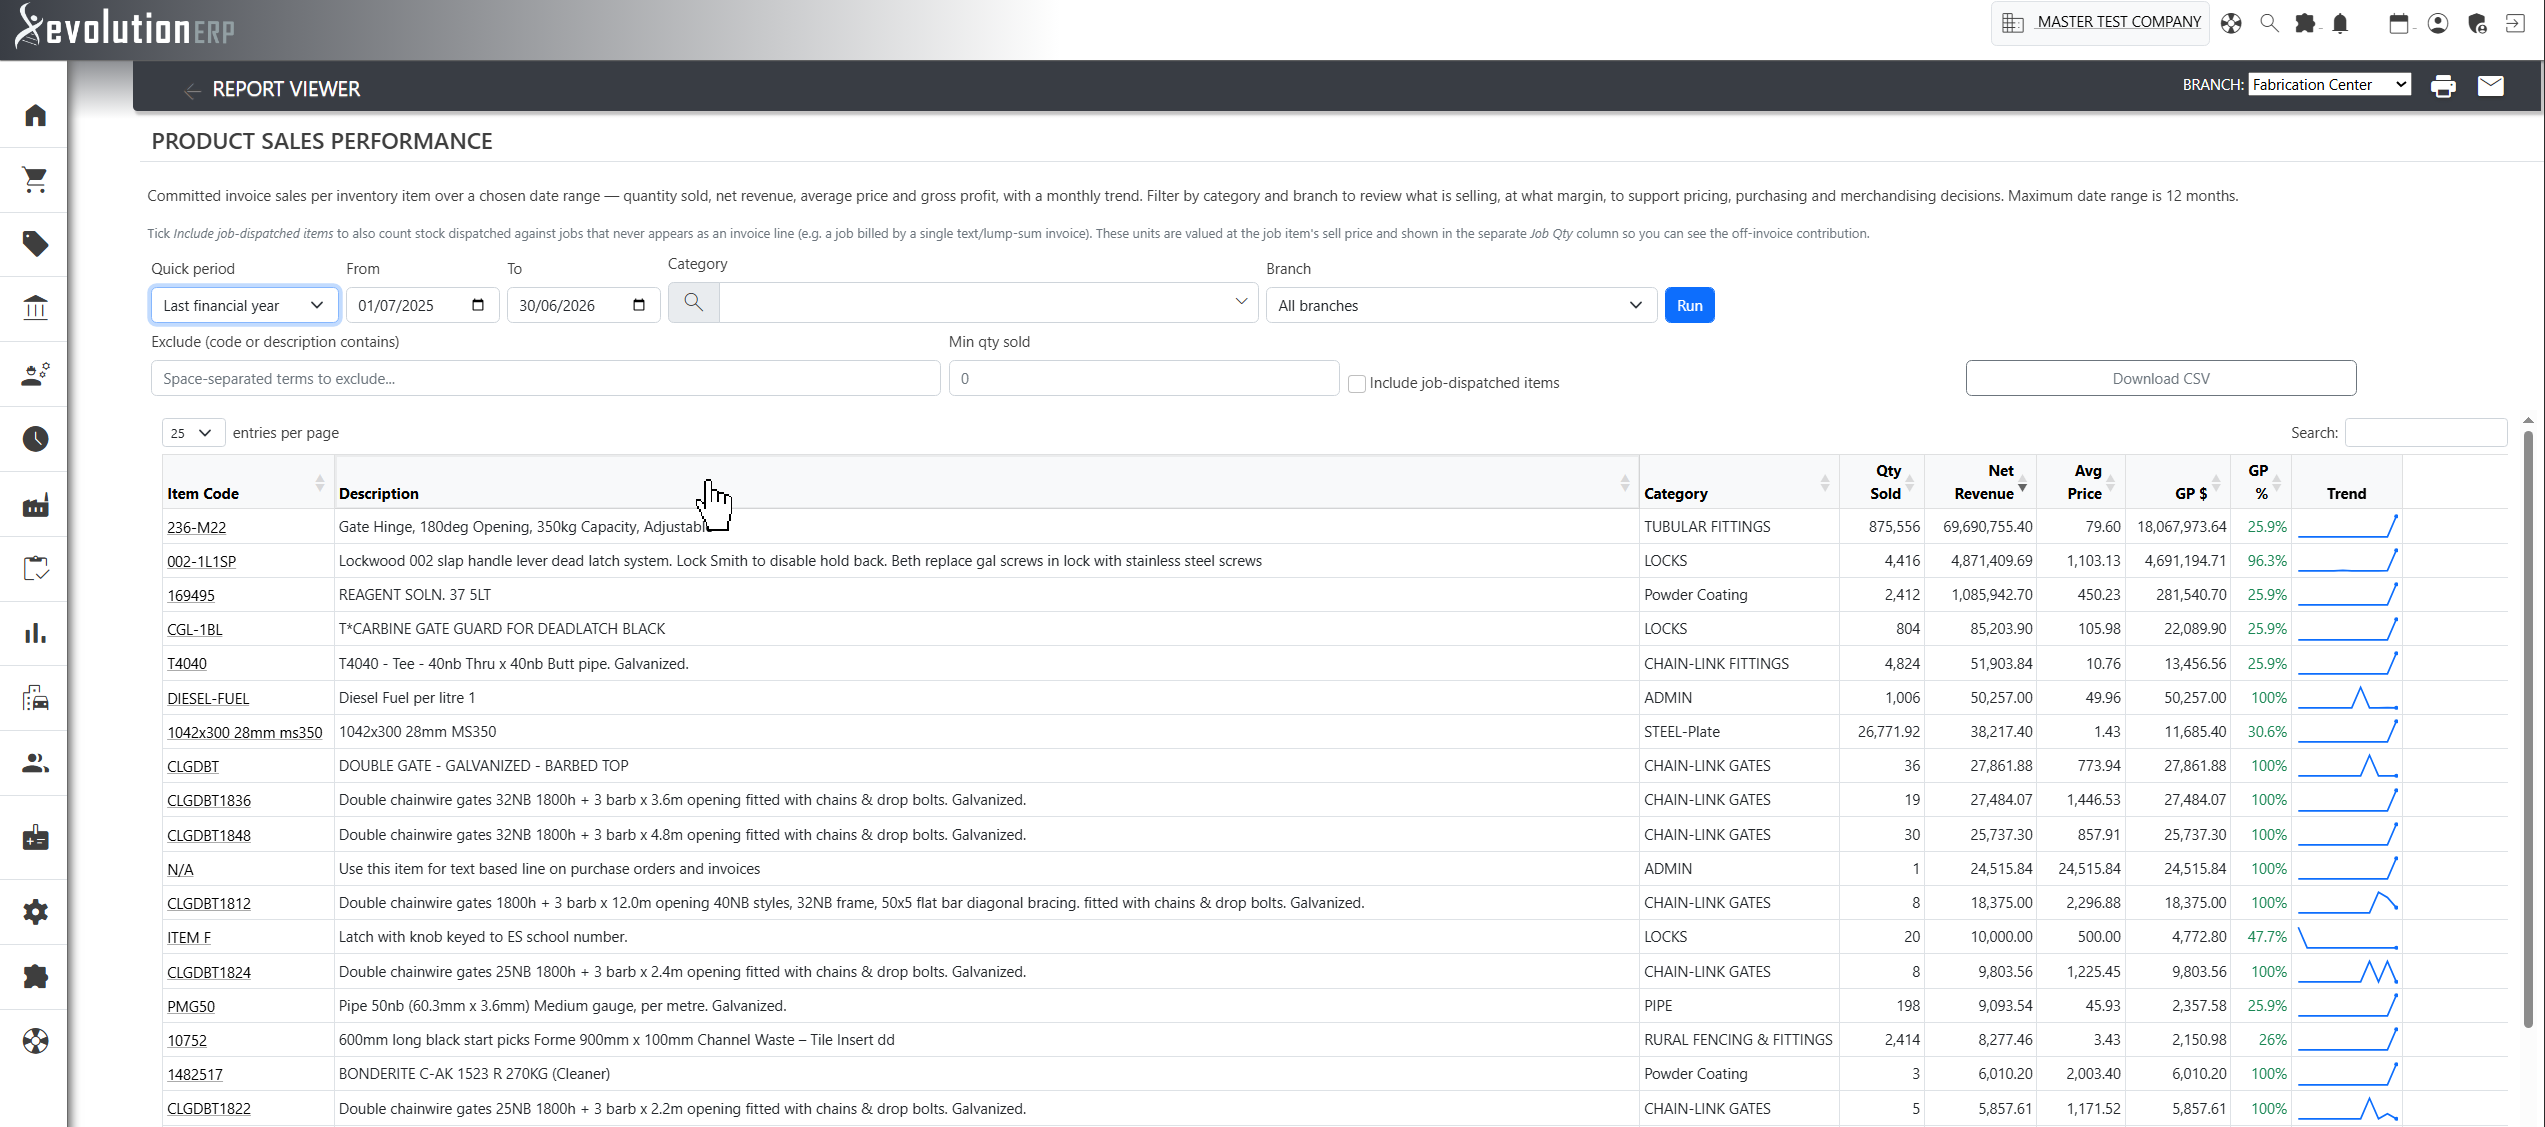
What it shows: One row per product over a chosen date range — quantity sold, net revenue, average sell price, gross profit ($ and %), and a monthly trend sparkline. A totals row summarises the whole result set.
How to use it:
- Pick a quick period (this financial year, last FY, this month, last 12 months…) or set an explicit From/To.
- Narrow by category (multi-select) and branch, exclude products by text, or set a minimum quantity.
- Tick Include project-dispatched items to also count stock dispatched against projects that never appears as an invoice line — for example a project billed by a single text / lump-sum invoice. Those units are valued at the project item’s own sell price and shown in a separate Project Qty column (with the off-invoice net revenue and GP in its tooltip), so you can see the full product movement without double-counting anything already itemised on an invoice.
- Sort any column — e.g. by GP % to find low-margin lines, or by Net Revenue to find your best sellers.
- Click a product code to open its Item History / Stock Card.
- Download CSV — per-month quantity columns are included so the trend is analysis-ready (with Project Qty / Project Net columns added when the project option is on). Up to 5,000 products are returned per run.
Item History / Stock Card
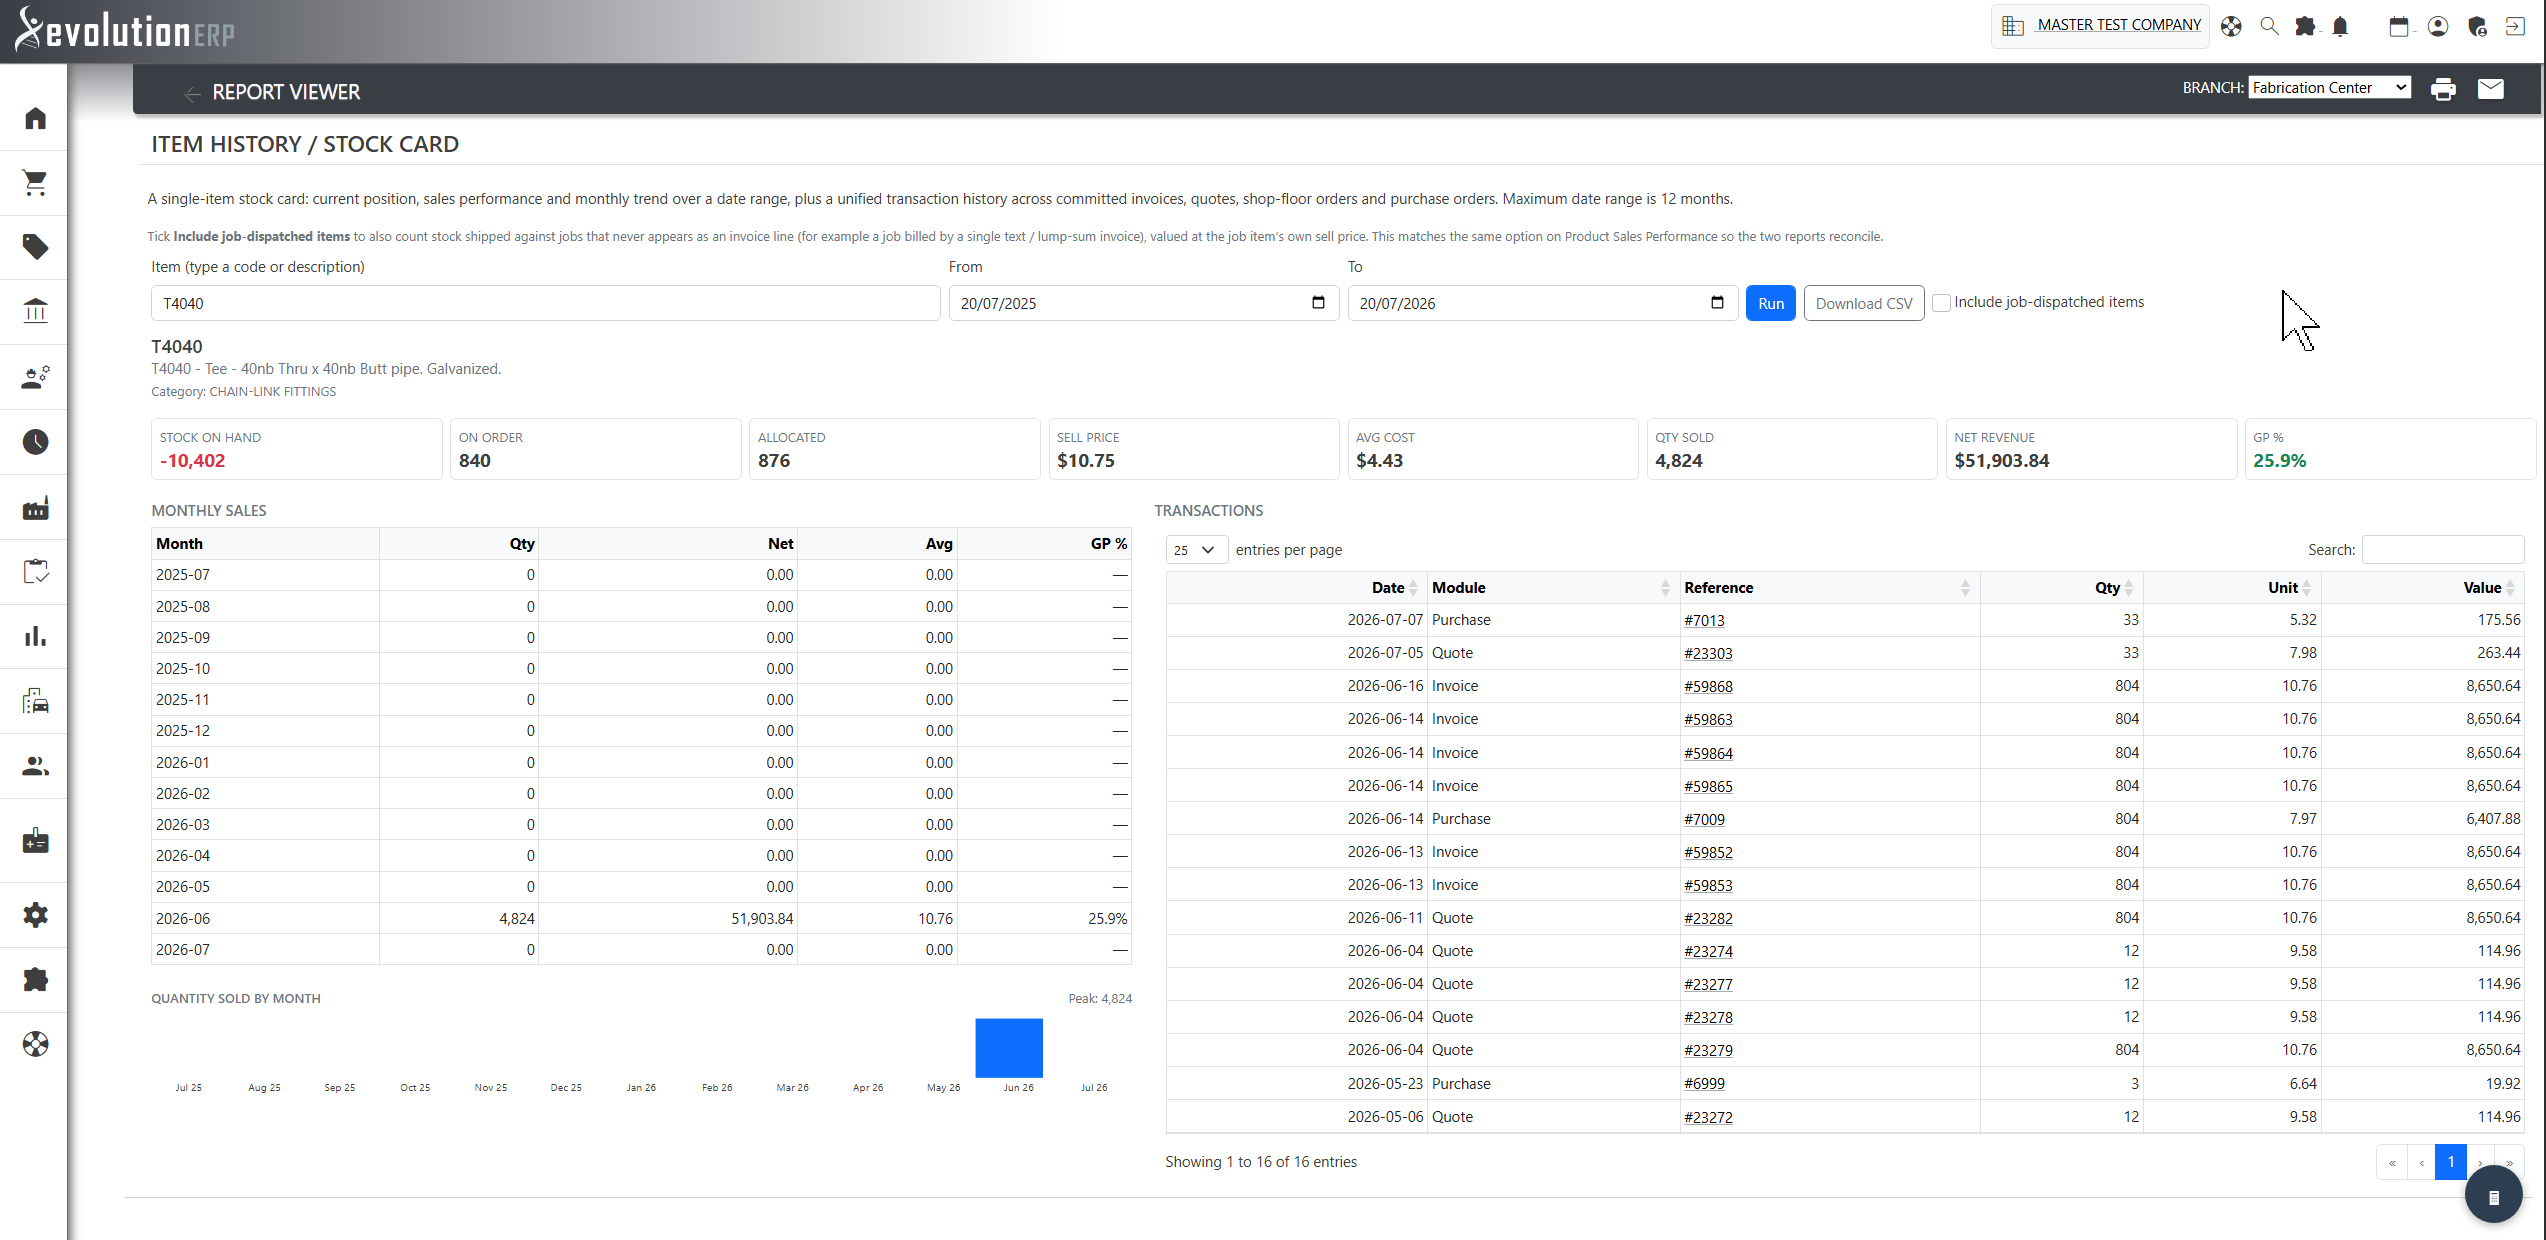
What it shows: A single-item drill combining current stock position (on hand, on order, allocated), sales KPIs and a monthly trend, plus a unified transaction history spanning committed invoices, quotes, shop-floor orders and purchase orders — each line clickable through to the source document.
How to use it:
- Start typing a code or description to pick the item (or arrive here by clicking a code on another report).
- Set a From/To date range (up to 12 months) and click Run.
- Read the KPI tiles for position and period performance; the monthly table and sparkline show the sales trend.
- Tick Include project-dispatched items to also count stock shipped against projects that never reaches an invoice line (for example a project billed by a single text / lump-sum invoice), valued at the project item’s own sell price. The KPI tiles then show how much of Qty Sold / Net came off-invoice, the affected months are flagged, and each project dispatch appears in the transaction list (click through to the project). This uses the same logic as Product Sales Performance, so the two reports reconcile.
- Use the searchable transaction table to trace every movement; Download CSV for the full list. The transaction history shows the 2,000 most recent movements in range.
Stock Movement Ledger
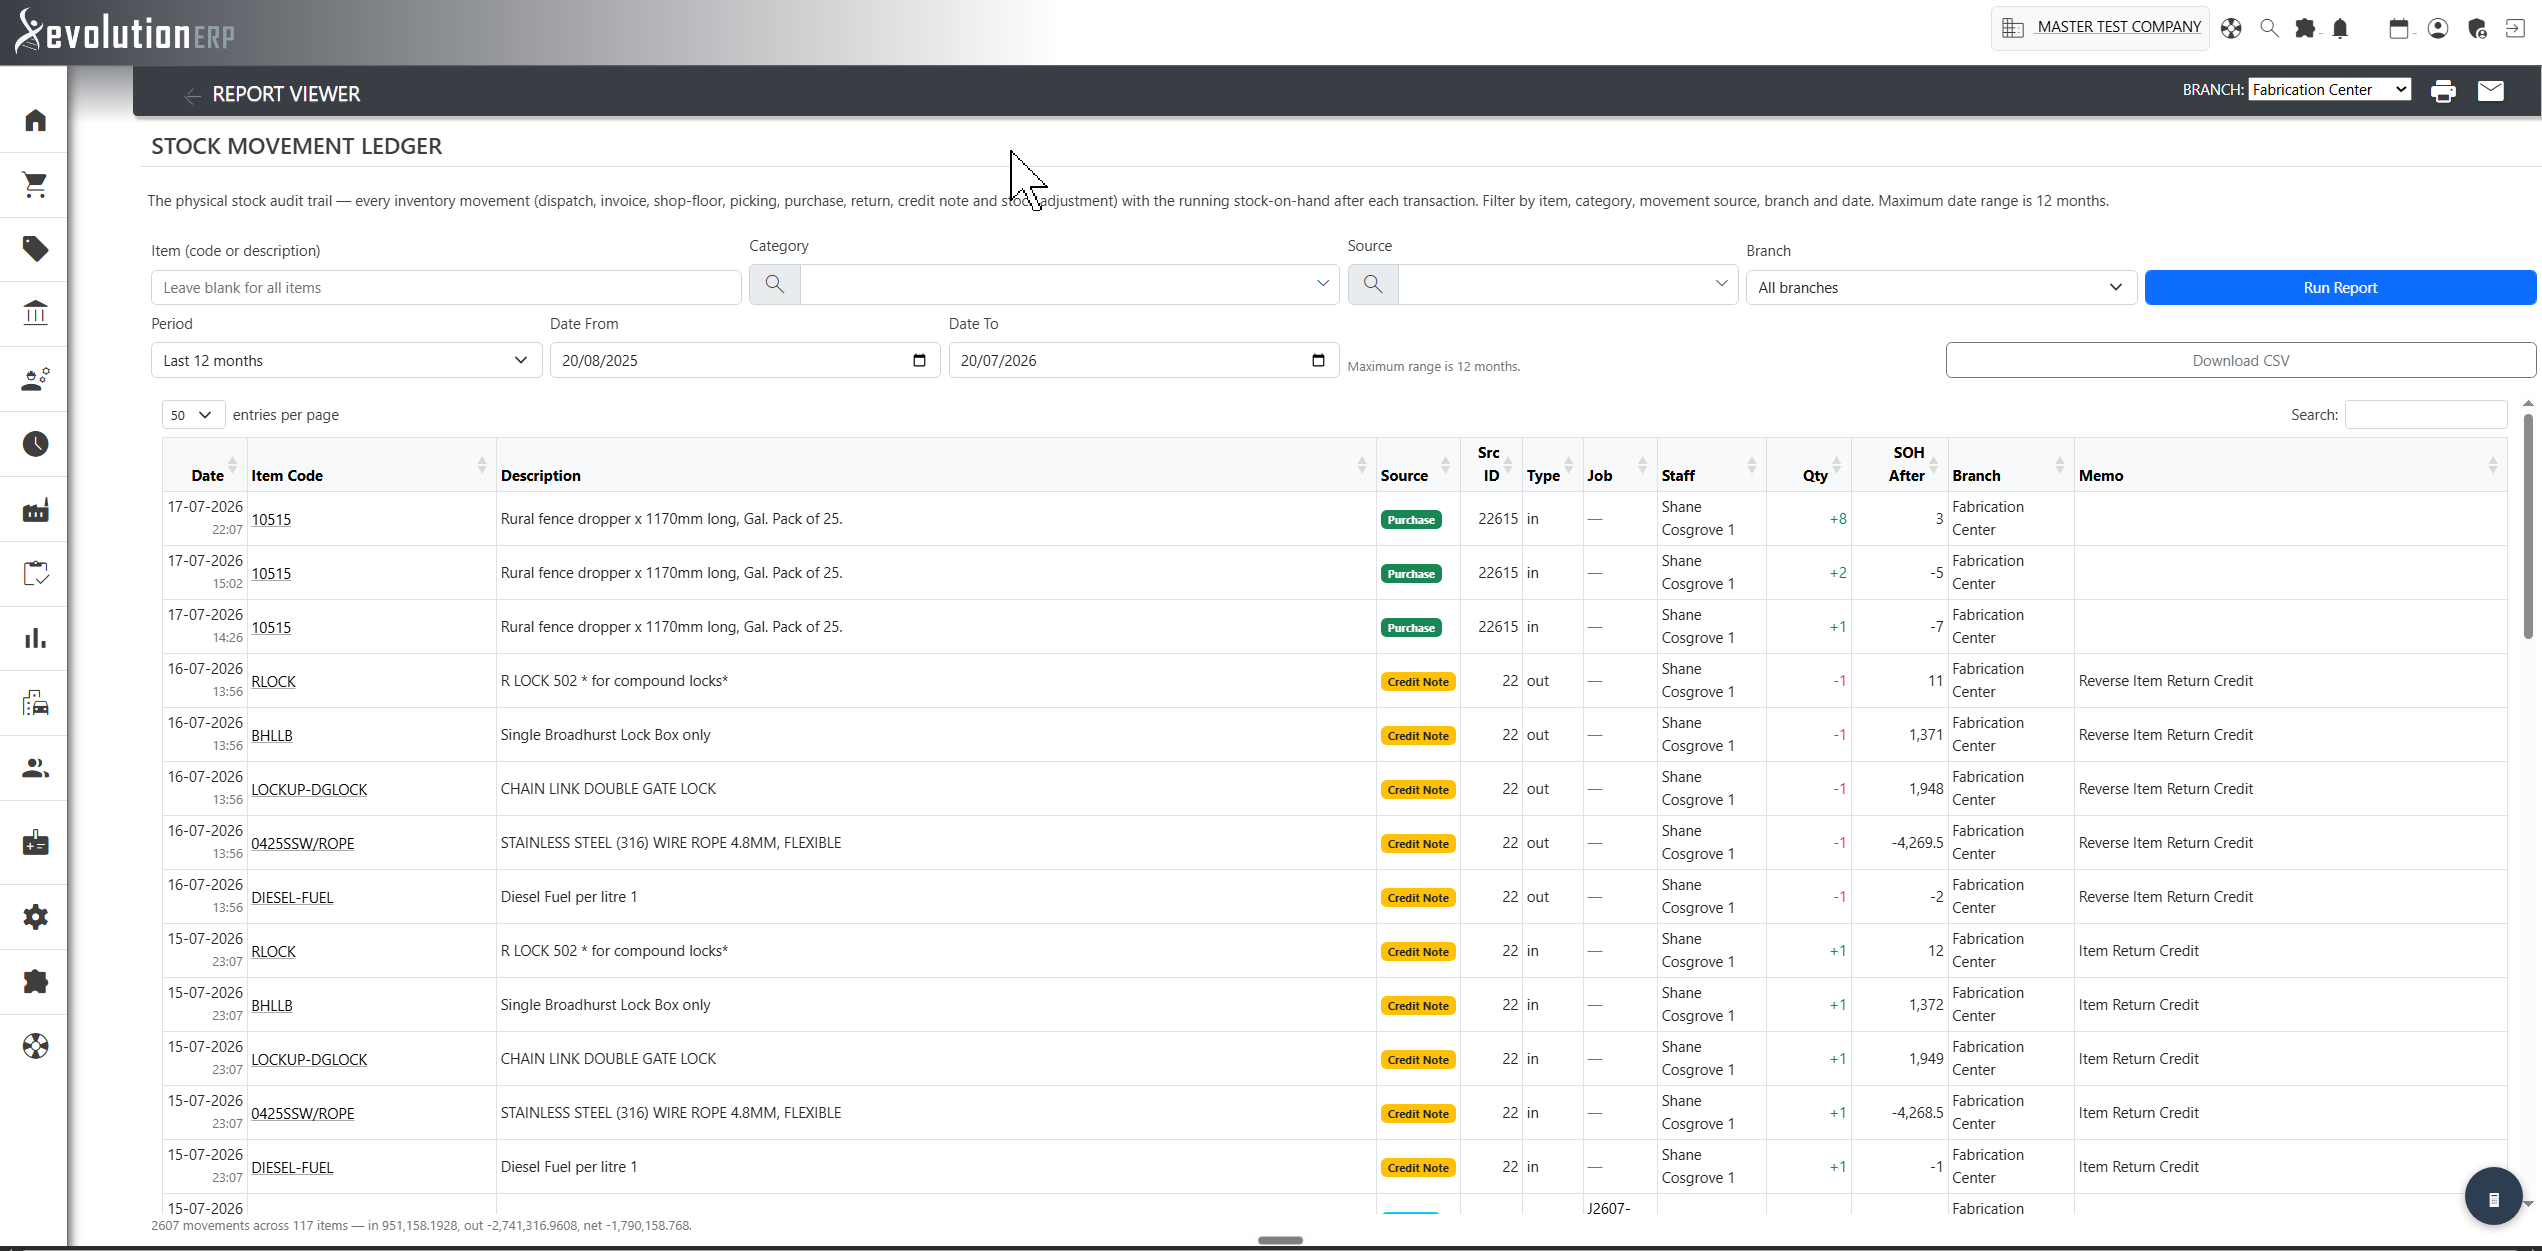
What it shows: The physical stock audit trail — every inventory movement in the period with its source, quantity in/out, and the running stock-on-hand after each movement. A summary line shows total in, out, net change and the number of distinct items in view.
How to use it:
- Pick a Period preset — This month, Last month, Last 3 months, Financial year to date, Last financial year, Calendar year to date or Last 12 months — to fill the dates for you, or set From/To by hand. The two date pickers keep each other inside the 12-month limit, so you can’t build a range the report will reject; editing a date by hand switches the Period back to Custom.
- Filter by item (code or id), category, movement source and branch.
- Each row shows the movement date and time (in your standard date format) and a colour-coded source badge — Purchase, Invoice, Dispatch, Picking, Shop Floor, Credit Note, Return and Stock Adjustment — so movement types are easy to tell apart. Quantities are signed (+ in / - out).
- Use it to audit a specific movement or investigate a stock-count discrepancy — the running SOH makes it easy to see where a balance went wrong. Every column sorts (including the date, which sorts in true chronological order).
- Click an item code to jump to its Item History / Stock Card, and Download CSV (which includes the movement time) for the filtered log. Up to 5,000 movements are returned per run — narrow by item or date if you hit it.
Data Quality
Product Coding Consistency
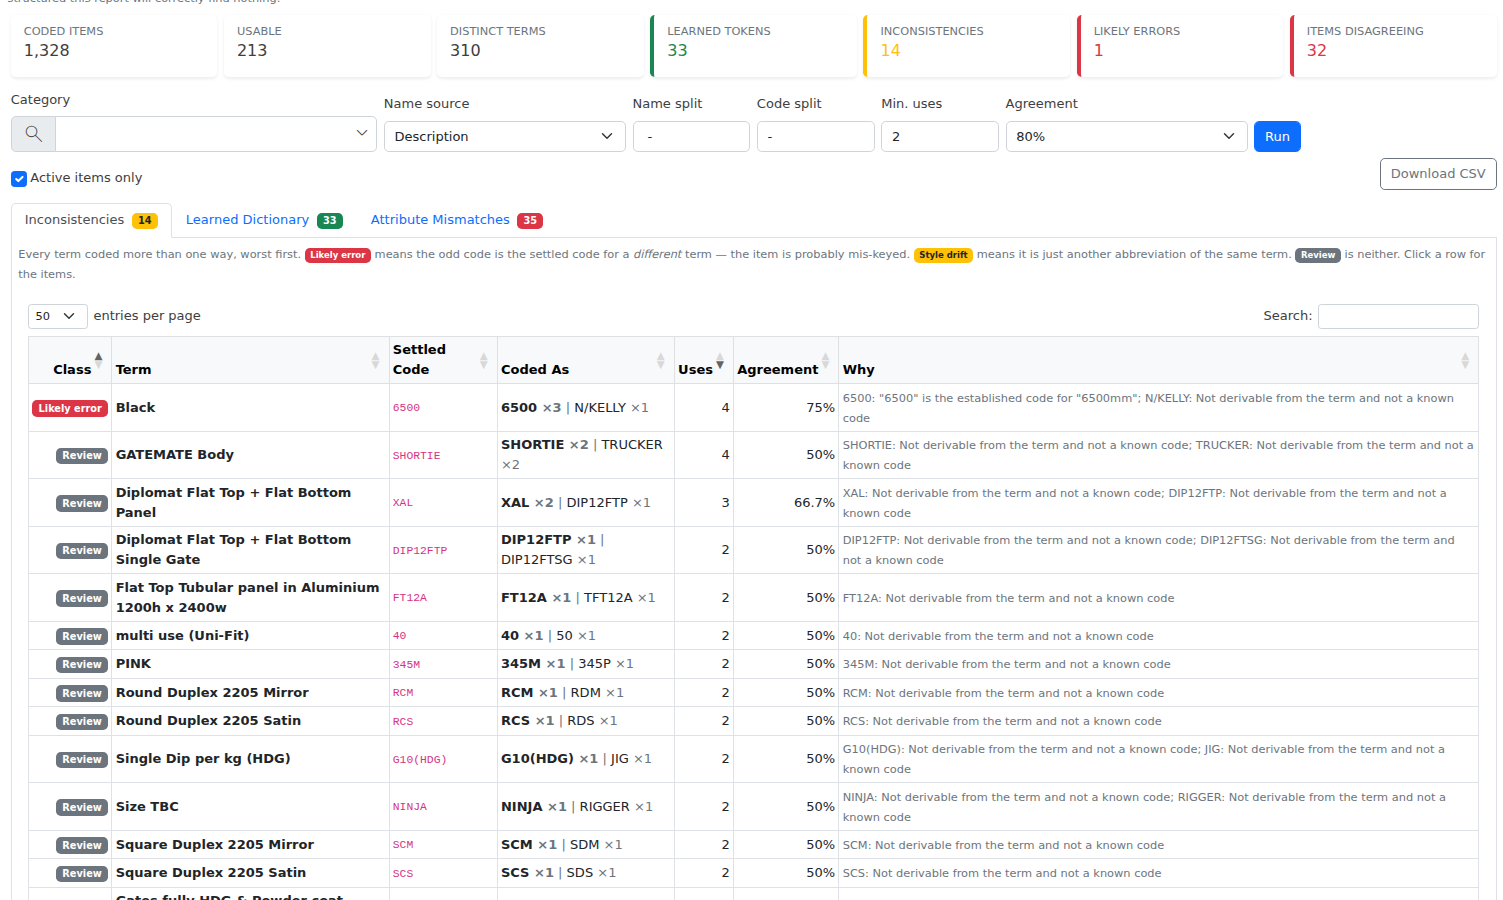
What it shows: Your product-coding convention, worked out from the items your team has already coded — and every term that has been coded more than one way. Nothing needs to be configured first: the report reads what is already there.
It works by lining a description up against its code. Where both split into the same number of parts, each part of the description is matched to the part of the code that encodes it:
Description   Fitting - Tee - PVC - Sched80 - 2"x3/4" - Socket x Socket
Code          FIT     - TEE - PVC - S80     - 2x3/4   - SxS
Seen once that proves nothing. Seen eighty times across the catalogue it is a rule your team has been following without ever writing it down.
How to use it:
- The Inconsistencies tab lists every term coded more than one way, worst first, in three classes. Likely error means the odd code means something else in your catalogue — a material coded as a different material, for example — so the item is probably mis-keyed and worth correcting. Style drift means it is only another abbreviation, a typo or a difference in case; harmless, but worth settling on one form. Review is neither and needs a human eye.
- The Learned Dictionary tab is your house style written down: each term, the code your team settles on, how many times it has been used and how consistently. This is useful on its own for training someone new, and it is the starting point for automatic code generation. Underneath it, Stored value → how it is written shows the same thing for your item attributes: where the attribute holds Sch80 and the description writes Sched80, that pairing is learned here.
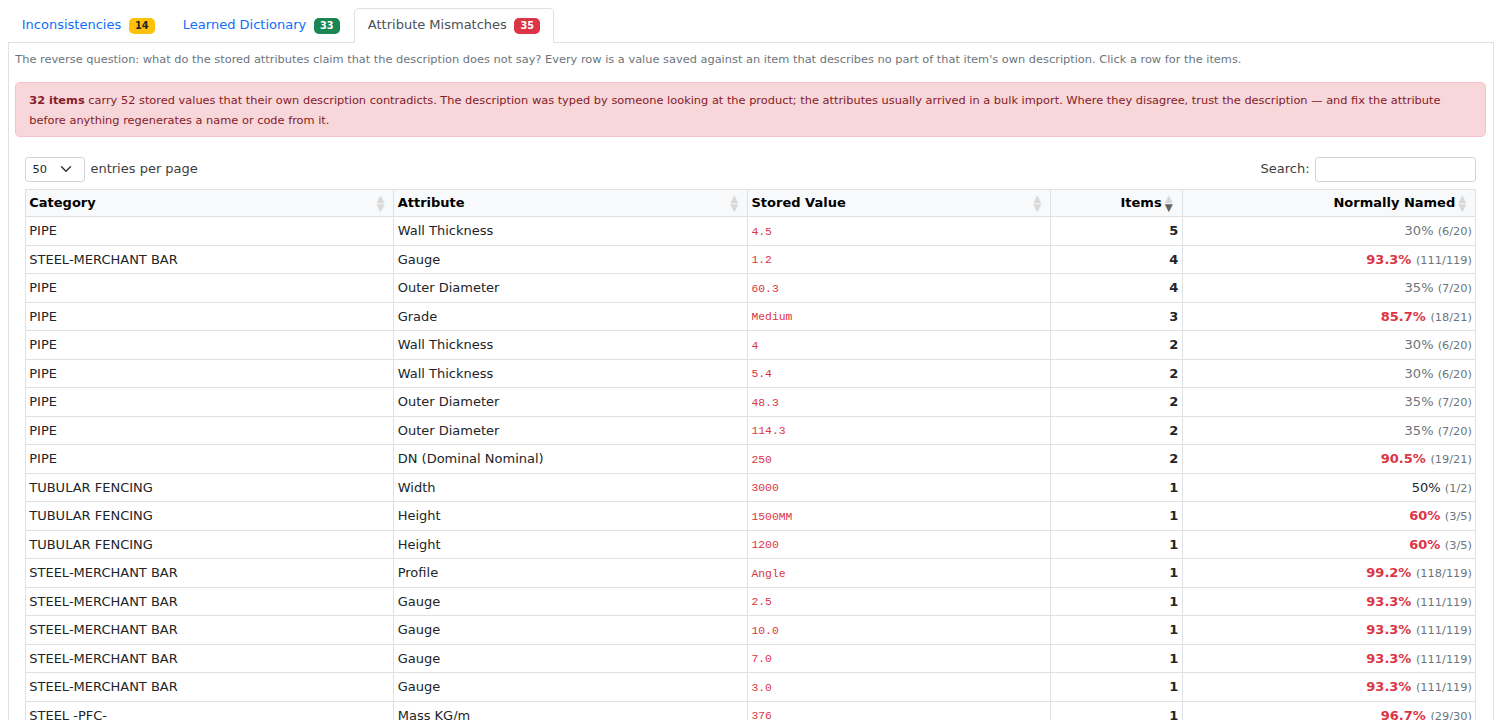
- The Attribute Mismatches tab asks the opposite question: not “how is this term coded” but “do this item’s saved attributes actually describe the item?” Every row is a value stored against an item that matches no part of that item’s own description — a flat bar whose Profile is saved as Angle, a black pipe whose coating is saved as Galvanized, a fitting described as PVC Sched80 but stored as HDPE. See below for how to read it.
- Click any row to see the items behind it, grouped by how each was coded, with the settled form and the odd ones out side by side. Every item code links straight to the item so you can correct it.
- Adjust Min. uses and Agreement to control how much evidence a term needs before it counts. Raising agreement to 100% surfaces every term with any variation at all; lowering it reports only the clearest cases.
- Set Name split and Code split to match how your own codes are punctuated, and Name source to whichever field holds your structured product name. Download CSV exports whichever tab you are on.
What it does not do: nothing is changed — this report only reads. Items whose description and code split into a different number of parts are skipped, because a shortened code can no longer be lined up without guessing; the summary line tells you how many. Terms coded a different way almost every time are also left out and counted separately: those descriptions are free text rather than structured, so there is no convention for them to be inconsistent with. If your item codes are not structured at all, this report will correctly find nothing.
Attribute Mismatches
Most items carry attributes as well as a description — material, class, diameter, grade. The two are meant to say the same thing, and on a well-kept item they do: the description reads Fitting – Tee – PVC – Sched80 – 2" and the attributes hold PVC, Sch80, 2".
This tab finds the items where they do not. For every value saved against an item, the report checks whether any part of that item’s own description accounts for it — allowing for the abbreviations and unit suffixes it learned on the Dictionary tab, so Sch80 still matches Sched80 and 10.0 still matches 10mm. What is left over is a value the description contradicts.
Which record is right? Nearly always the description. It was typed by somebody looking at the product; attributes usually arrived in a bulk import or were copied from a similar item and never revisited. So the mismatch is normally a fault in the attribute, and it is worth fixing on its own merits — those attributes drive searching, filtering and reporting, so a flat bar filed as an angle is invisible to anyone looking for flat bar.
How to read a row:
- Items is how many items in that category store that value without describing it. Work down from the top — one wrong value repeated across thirty items is usually one bad import, and one fix.
- Normally Named is the strength of the finding: how often that attribute does appear in the description elsewhere in the same category. At 90% the attribute is clearly meant to be there and its absence is a real disagreement — those rows are shown in bold red. At 30% it is only a hint, and is greyed out. Sort by this column to put the most certain findings first.
- Click a row to list the items, each linking straight to the item so you can read the description and correct the attribute against it.
Underneath the table, Attributes this category never names collects the values that are also unaccounted for but harmlessly so: no item in the category puts that attribute in its description, so it simply is not part of how you name those products. Nothing to fix — but worth knowing, because it tells you which attributes a naming or coding template should not ask for.
A note on what counts as a mismatch: the check is deliberately generous. Numbers must agree — 4.5 will not match 45 — but decimal formatting is ignored, so 10.0, 10 and 10mm are treated as the same value, and abbreviations, prefixes and word order are allowed for. An attribute is only reported when nothing in the description accounts for it at all.